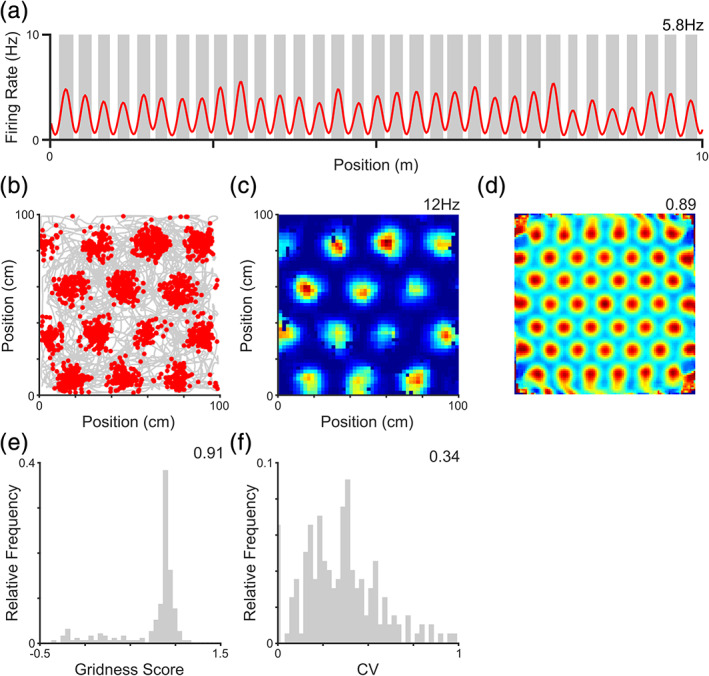
Figure 1.

The grid cell rate code. As observed in vivo, simulated grid cells exhibit a firing rate code for location that corresponds to periodic spatial firing fields both (a) on a linear track; and (b) in the open field. This is confirmed by an inspection of the (c) firing rate map (peak rate inset); and (d) spatial autocorrelation (gridness score inset). (e) Distribution of gridness scores across the population, which are significant for all cells (median value inset). Lower gridness scores are produced by larger scale grids, which typically exhibit only two firing fields within the environment. (f) Finally, grid cells show substantial variation of peak in‐field firing rates, quantified using the coefficient of variation (CV) for each cell (median value inset). Panel a shows data from a single simulated grid cell, averaged over 20 independent simulations; panels b–d show data for a single simulated grid cell from a single simulation; panels e and f for the entire grid cell population from a single simulation [Color figure can be viewed at wileyonlinelibrary.com]
