Figure 1.

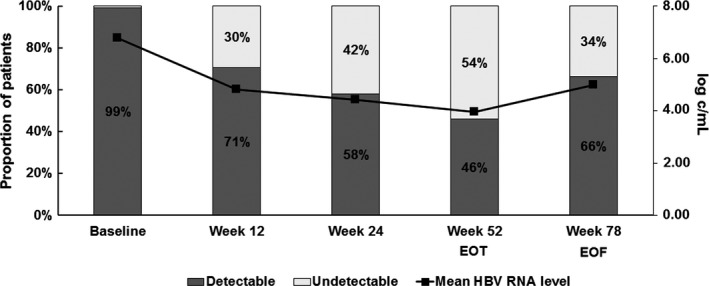
HBV RNA dynamics and detectability in the total study population (N = 266). The line represents mean level of HBV RNA (log c/mL); bars represent the proportion of patients with either detectable or undetectable HBV RNA

HBV RNA dynamics and detectability in the total study population (N = 266). The line represents mean level of HBV RNA (log c/mL); bars represent the proportion of patients with either detectable or undetectable HBV RNA