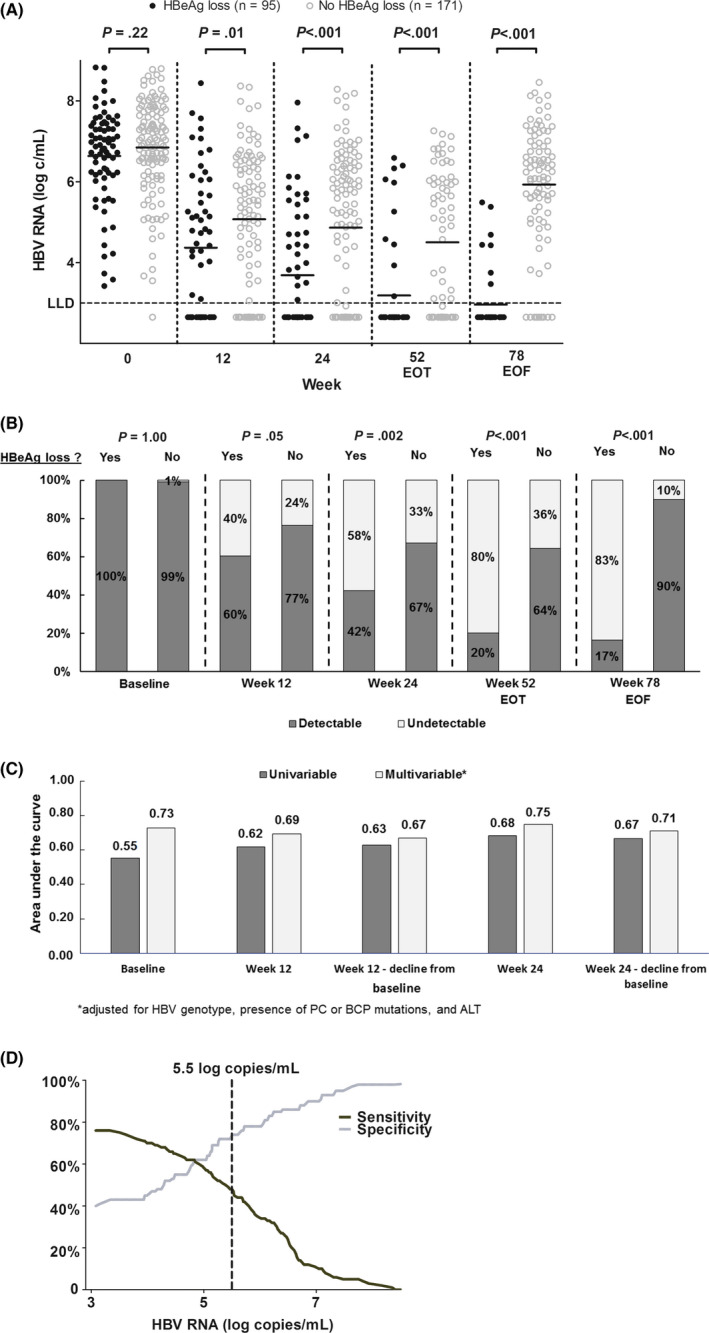
Figure 3.

A, Individual HBV RNA measurements according to HBeAg loss at the end of follow‐up. Dots represent individual HBV RNA measurements according to HBeAg loss at the end of follow‐up, with lines representing the mean level of HBV RNA (log c/mL). The red dotted line indicates a previously proposed HBV DNA cut‐off for the early identification of nonresponse (10). B, HBV RNA detectability according to HBeAg loss at the end of follow‐up. Bars represent the proportion of patients with detectable or undetectable HBV RNA levels according to HBeAg loss at the end of follow‐up. C, Univariable and multivariable diagnostic accuracy of early on‐treatment HBV RNA for the prediction of HBeAg loss at the end of follow‐up. Bars represent the area under the curve (AUC) for HBV RNA at baseline, week 12 and week 24 for the prediction of HBeAg loss at the end of follow‐up. Bars in dark grey represent univariable analysis; bars in light grey represent multivariable analysis adjusting for HBV genotype, ALT level, and presence of BCP or PC mutations. D, HBV RNA cut‐off for the prediction of HBeAg loss at the end of follow‐up. The dark line and grey line represent sensitivity and specificity of HBV RNA level for the prediction of HBeAg loss at the end of follow‐up
