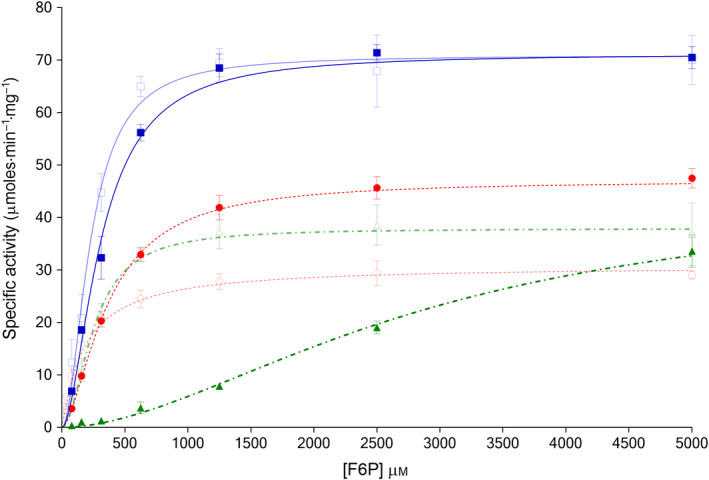
Figure 2.

Kinetic plots with respect to fructose 6‐phosphate titrations for Trypanosoma cruzi PFK (TcPFK) ( , blue line), Trypanosoma brucei PFK (TbPFK) (
 , dotted red line) and Leishmania infantum PFK (LiPFK) (
 , dot‐dashed green line) show different kinetic properties for each enzyme. Effects of 1 mm AMP, shown alongside for TcPFK (□, pale blue line), YbPFK (○, dotted red line) and LiPFK (△, dot‐dashed green line) show disproportionate activation for LiPFK. Data were fitted with a sigmoidal curve given by the equation for a cooperative (allosteric) model (n = 3; error bars represent standard deviations; 1.5 mm ATP).
