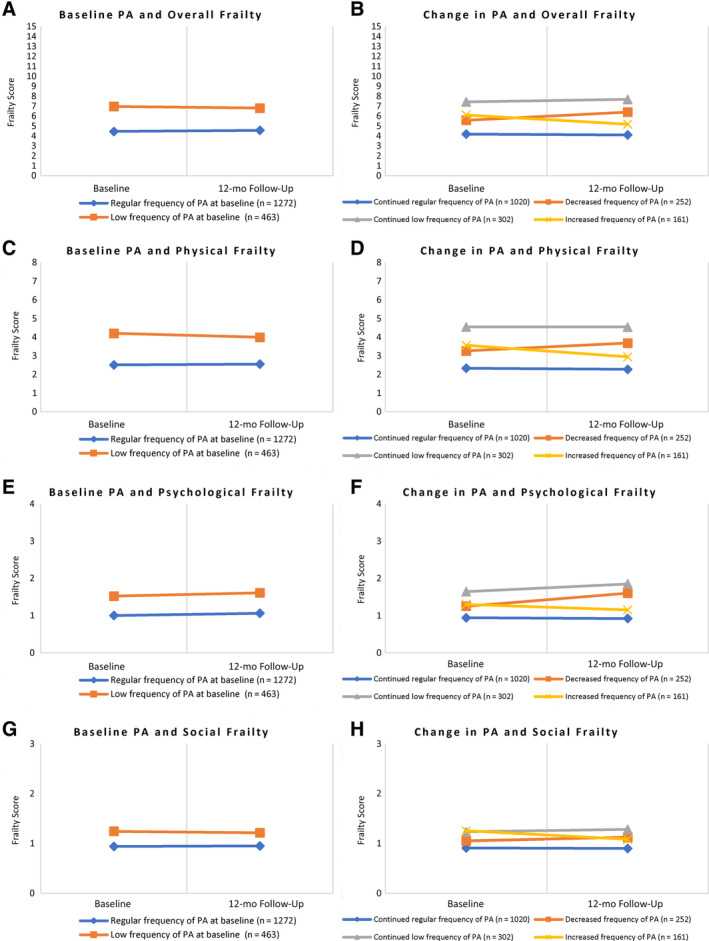
Figure 2.

Frailty score at baseline and follow‐up of participants from the groups of frequency of moderate physical activity (PA). (A) Baseline PA and overall frailty, (B) Change in PA and overall frailty, (C) Baseline PA and physical frailty, (D) Change in PA and physical frailty, (E) Baseline PA and psychological frailty, (F) Change in PA and psychological frailty, (G) Baseline PA and social frailty, (H) Change in PA and social frailty.
