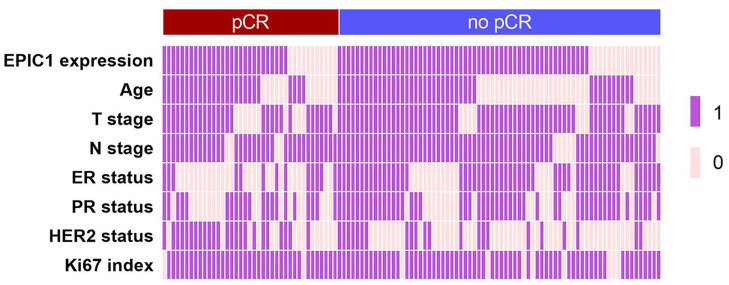
Figure 2.
Clinicopathological features of pathological complete response (pCR; n = 39) and no-pCR (n = 72) patients.
Two-category data (EPIC1 expression high versus low, age ⩾50 versus <50 years, T stage 3–4 versus 2, N stage 1–3 versus 0, ER positive versus negative, PR positive versus negative, HER2 positive versus negative, and Ki67 index ⩾20% versus <20%) are shown with values 1 and 0, respectively.
ER, estrogen receptor; HER2, human epidermal growth factor receptor 2; N stage, nodal stage; PR, progesterone receptor; T stage, tumor stage.

