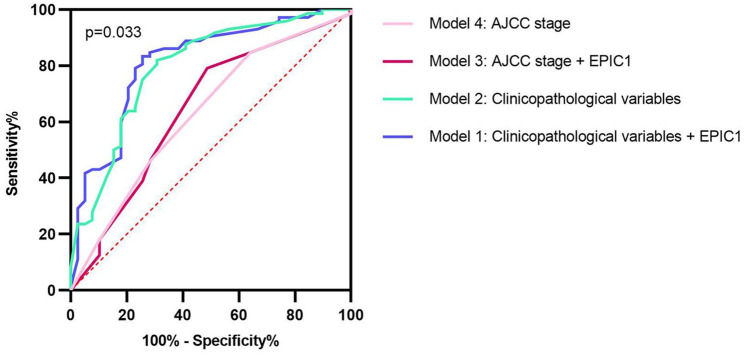
Figure 3.
Receiver operating characteristic curves of different predictive models for pathological complete response.
The blue line exhibits model 1 (AUC 0.812, incorporating EPIC1 expression, age, T stage, N stage, ER status, PR status, HER2 status, and Ki67 index). The green line shows model 2 (AUC 0.795, including all the factors in model 1 except EPIC1 expression). The red line represents model 3 (AUC 0.644, integrating EPIC1 expression and AJCC stage). The pink line is presented with model 4 (AUC 0.630, AJCC stage alone). The AUC values are compared using the z-test.
AJCC, American Joint Committee on Cancer; AUC, area under the curve; ER, estrogen receptor; HER2, human epidermal growth factor receptor 2; N stage, nodal stage; PR, progesterone receptor; T stage, tumor stage.

