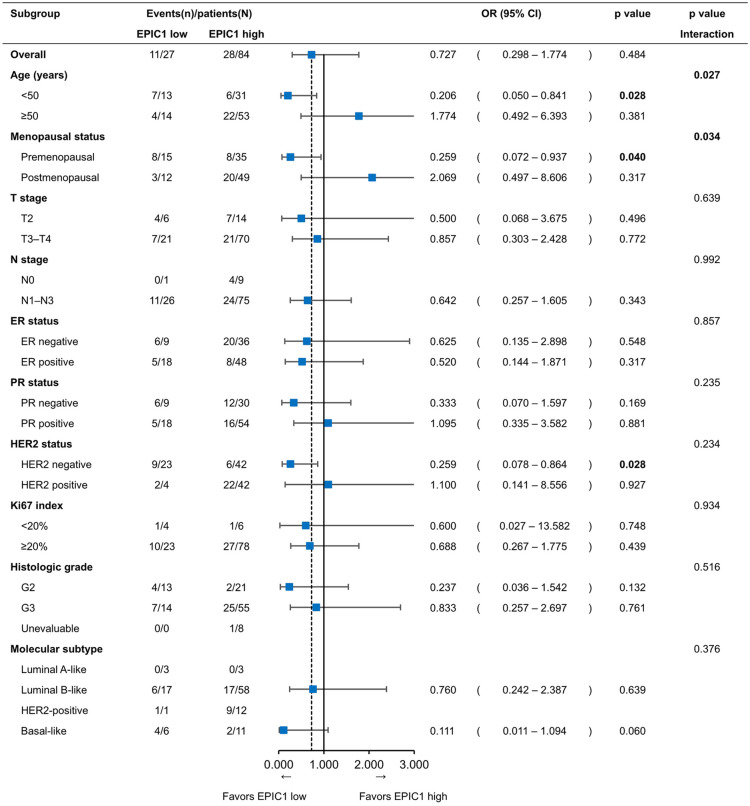
Figure 4.
Subgroup analysis for pathological complete response according to EPIC1 expression levels.
ORs are derived from the logistic regression model. Interaction p values are presented between different subgroups and the expression level of EPIC1.
CI, confidence interval; ER, estrogen receptor; HER2, human epidermal growth factor receptor 2; OR, odds ratio; PR, progesterone receptor.

