
Figure 5.
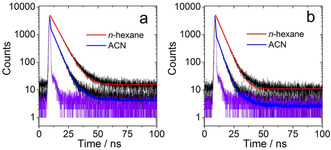
Fluorescence decay traces of the compounds in different solvents. a) BDP‐1 at 650 nm and b) BDP‐2 at 650 nm. λ ex=635 nm, c=1.0×10⁻⁵ M. 20 °C. The IRF curves of the spectrometer are also presented.
Official websites use .gov
A
.gov website belongs to an official
government organization in the United States.
Secure .gov websites use HTTPS
A lock (
) or https:// means you've safely
connected to the .gov website. Share sensitive
information only on official, secure websites.
Fluorescence decay traces of the compounds in different solvents. a) BDP‐1 at 650 nm and b) BDP‐2 at 650 nm. λ ex=635 nm, c=1.0×10⁻⁵ M. 20 °C. The IRF curves of the spectrometer are also presented.