
Figure 7.
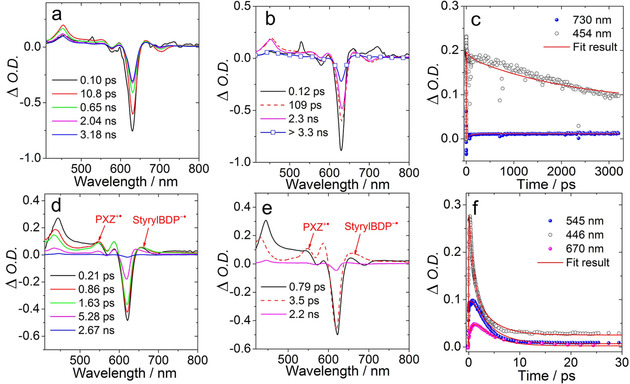
Femtosecond transient absorption spectra of BDP‐1. a) Transient absorption spectra in toluene. λ ex=630 nm, c=1.0×10⁻⁵ M, b) species‐associated difference spectra (SADS), and c) decay traces at selected wavelengths. d) Transient absorption spectra of BDP‐1 in ACN (λ ex=625 nm, c=1×10⁻⁵ M), e) species‐associated difference spectra (SADS), and f) Decay traces at selected wavelengths. SADS were obtained by global fitting in sequential model. 20 °C.