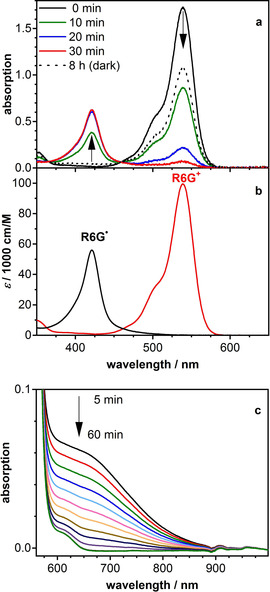
Figure 1.

a) Absorption spectra of rhodamine 6G in DMSO (c=1.7×10⁻⁵ m) with DIPEA (c=0.2 m) at different times during illumination with a green LED. The dotted line is the spectrum recorded after 8 h of recovery in the dark in the absence of oxygen. b) Spectra of rhodamine 6G (R6G+) and its radical (R6G.) obtained by deconvolution of the time‐spectral data by using the self‐modelling method. c) Sequence of absorption spectra recorded during back‐oxidation of the radical (c(R6G)=3.0×10⁻⁴ m).
