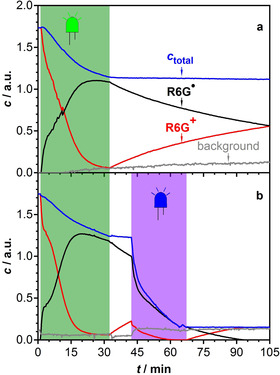
Figure 2.

Time profiles of R6G+ and R6G. in a solution of R6G+ and DIPEA in DMSO obtained by deconvolution of the time‐spectral data by using the self‐modelling method. The sum of the concentrations is denoted by c total. A third component denoted as background was included in the model to account for instrumental drifts and other generated species. a) Excitation with a green LED for 30 min (green‐shaded area) and subsequent dark reaction. b) As for panel a) with an additional phase of irradiation with a violet LED (420 nm) during the time highlighted by the violet shaded area.
