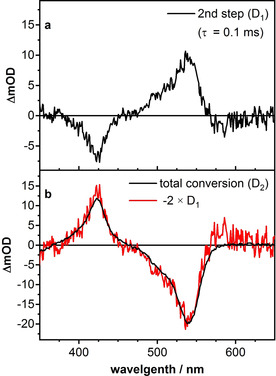
Figure 4.

DADS from the global lifetime analysis of the transient absorption measurements of rhodamine 6G in a solution of DMSO and DIPEA. a) D1 describes the slower generation process (τ=0.1 ms). b) D2 corresponds to the total generated radical. The red curve represents D1 multiplied by a factor of −2.0, to show that half of the total generated radicals stem from the slower process.
