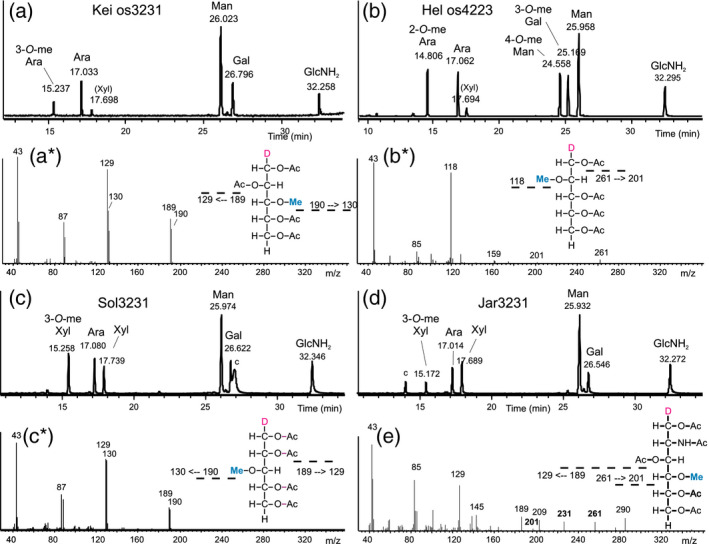
Figure 3.

Monosaccharide analysis of selected glycan groups.
Panels (a–d) show the results of GC‐MS analysis of the highly enriched glycans with m/z = 1343.5 from Kei‐C‐1, 1401.5 from Hel‐C‐32, and 1343.5 from both Sol‐C‐39 and Jar‐C‐75 respectively. (a*, b*, and c*) are the fragment spectra of peaks at 15.2, 14.8, and 15.2 min showing 3‐O‐methyl‐arabinose and 2‐O‐methyl‐arabinose and 3‐O‐methyl‐xylose respectively. Ambiguity between 3‐O‐methyl‐arabinose and 3‐O‐methyl‐xylose was resolved by hypermethylation (Figure S1). Panel (e) depicts the spectrum of 4‐O‐methyl‐N‐acetylglucosamine in sample Sun C‐36 (see also Figure S8).
