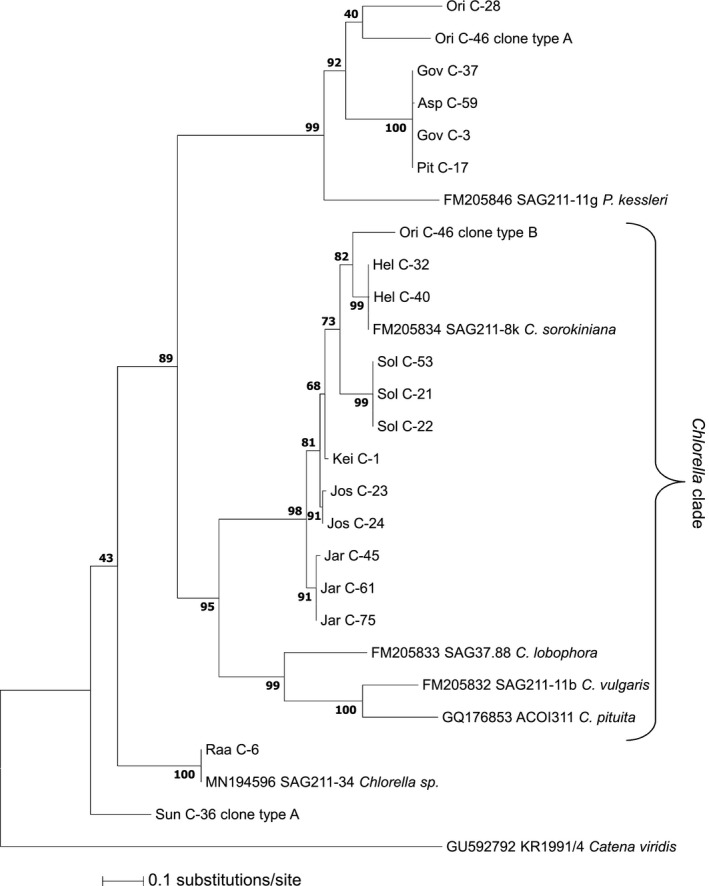
Figure 5.

Molecular phylogeny of the ITS1–5.8S–ITS2 rDNA sequences.
Relevant culture collection strains and commercial Chlorella products were compared with Catena viridis as the outgroup. The tree was rooted on midpoint. Numbers at nodes represent normalized bootstrap values of 1000 replicates in per cent. GenBank accession numbers and culture collection strain numbers are given for all database entries. Product sequences are documented in Data S1.
