
FIGURE 4.
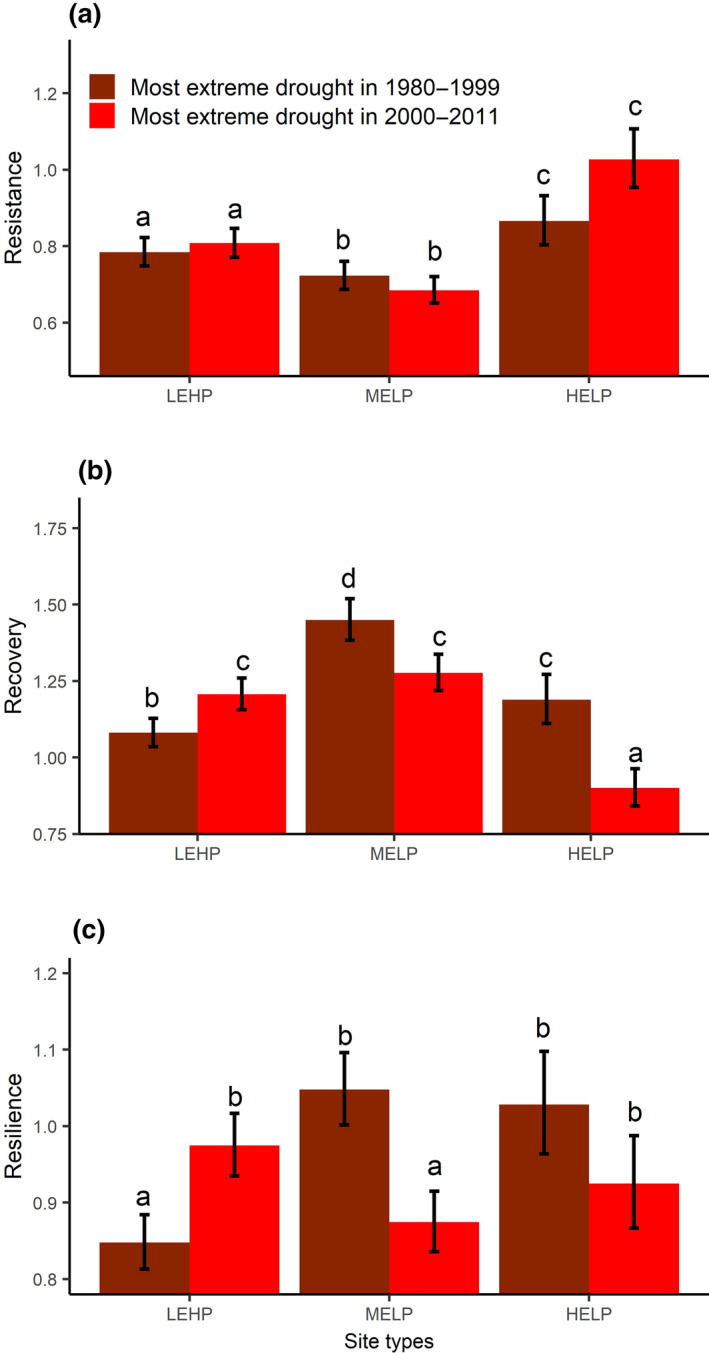
Tree‐level resistance (a), recovery (b), and resilience (c) to the most extreme drought during 1980–1999 and during 2000–2011 for three site types. Error bars represent the mean ± standard error (n = 615). Letters on top of the bars show the results (a < b < c) of the post hoc Tukey multiple comparison test with a threshold <0.05 for statistical significance indicating the differences among the three site types and between the two periods within each site type. HELP, high‐elevation sites with low productivity; LEHP, low‐elevation sites with high productivity; MELP, mid‐elevation sites with low productivity