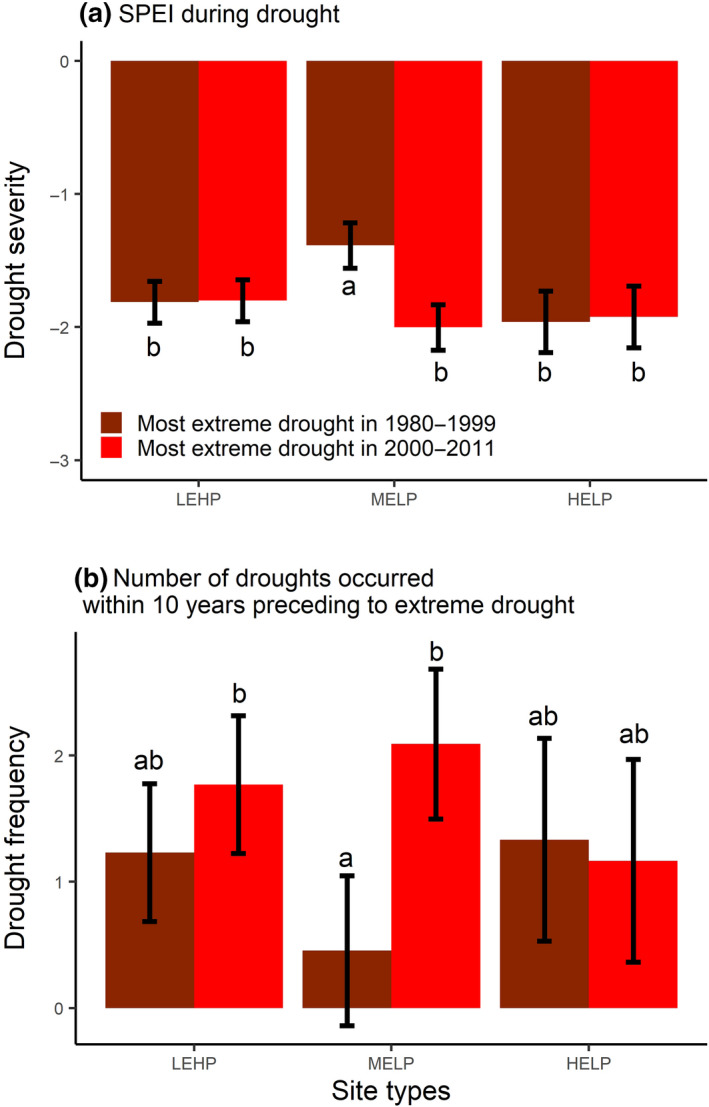
FIGURE 6.

Drought severity (measure by the SPEI [Standardized Precipitation and Evapotranspiration Index]) (a) and drought frequency (measured by the number of droughts that occurred within 10 years preceding extreme drought) (b) during and prior to the examined extreme drought, respectively. Error bars represent the mean ± standard error (n = 30). Letters on top of the bars show the results (a < b < c) of the post hoc Tukey multiple comparison test with a threshold <0.05 for statistical significance. HELP, high‐elevation sites with low productivity; LEHP, low‐elevation sites with high productivity; MELP, mid‐elevation sites with low productivity
