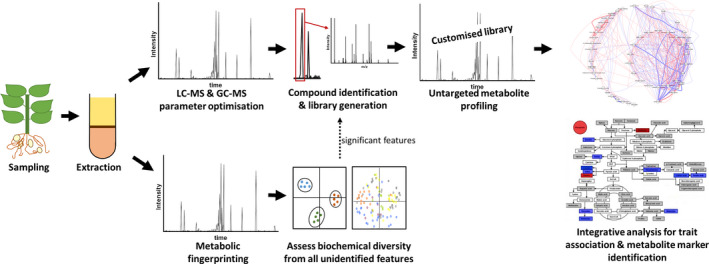
Figure 2.

Workflow of metabolomics analysis established to screen biochemical diversity of root, tuber, and banana crops. The use of numerous and complementary analytical platforms provides a more comprehensive coverage of the metabolome; customized libraries specific for each crop reduce matrix effects. Metabolic fingerprint analysis typically takes c. 20 min per sample and generates c. 10 000 features, with data analysis being c. 1 h per 100 samples. Library creation is on‐going but requires c. 20 h per crop before implementing automation, inclusive of machine time. Untargeted metabolite profiling takes c. 60 min per sample per analytical platform and data analysis plus manual curation takes c. 10 h per 100 samples. Example statistical visualizations created using SIMCA‐P (Umetrics), Metscape (Basu et al., 2017) in Cytoscape (Shannon, 2003), and an in‐house pathway mapper, Biosynlab (Royal Holloway University of London, UK).
