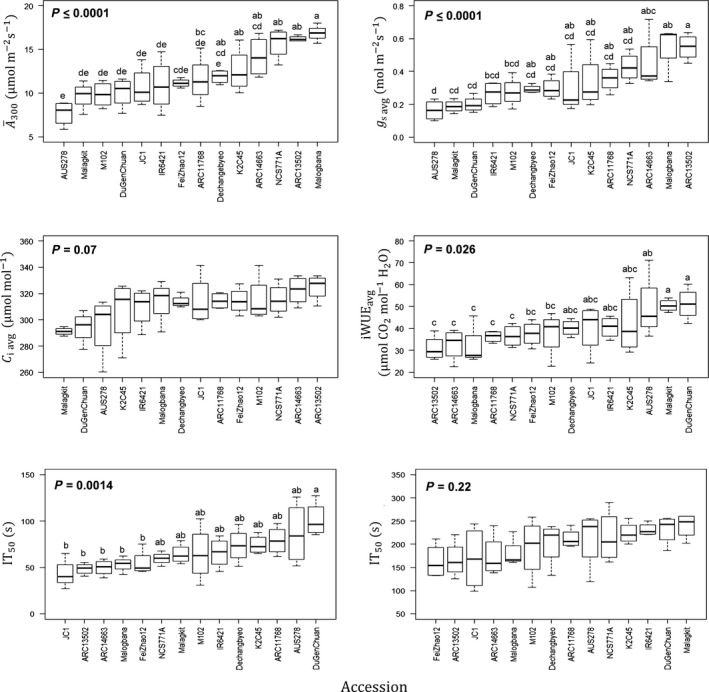
Figure 2.

Mean and variation for all rice (Oryza sativa) accessions for average leaf CO2 uptake during the first 300 s of induction (), average A stomatal conductance during the first 300 s of induction (g s avg), average intrinsic water‐use efficiency (), average intercellular CO2 concentration during the first 300 s (C i avg), and time that A reached 50% and 90% of A 300 (IT50 and IT90, respectively). The accessions are ranked by increasing mean for each parameter. Different letters represent statistically significant differences (P < 0.05) between different accessions.
