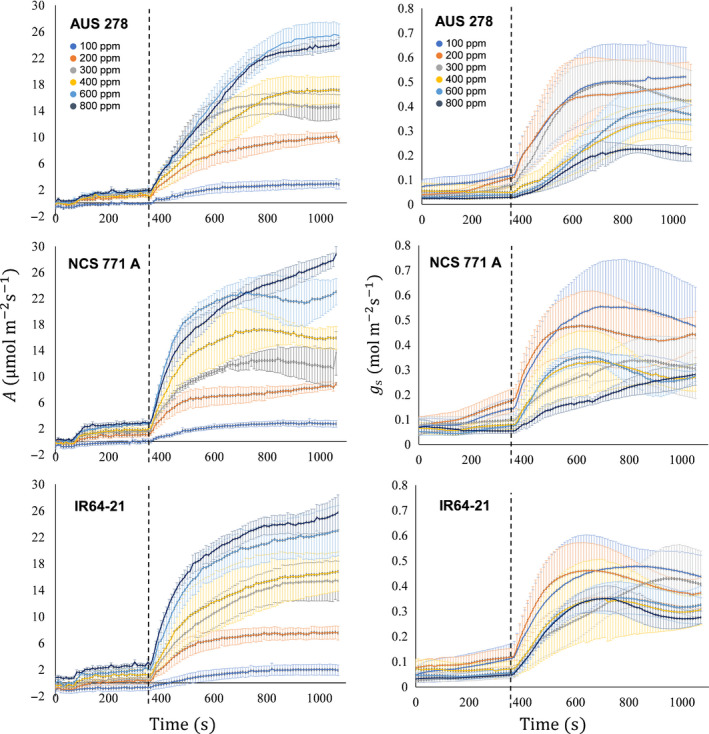
Figure 4.

Induction of leaf CO2 uptake A and stomatal conductance g s at [CO2] = 100, 200, 300, 400, 600 and 800 µmol mol−1 for three rice (Oryza sativa) cultivars. Each point is the mean (± SE) of four plants. The dashed vertical line at 360 s represents the point of transition from low to high photosynthetic photon flux density (50–1700 µmol m−2 s−1); that is, the start of induction.
