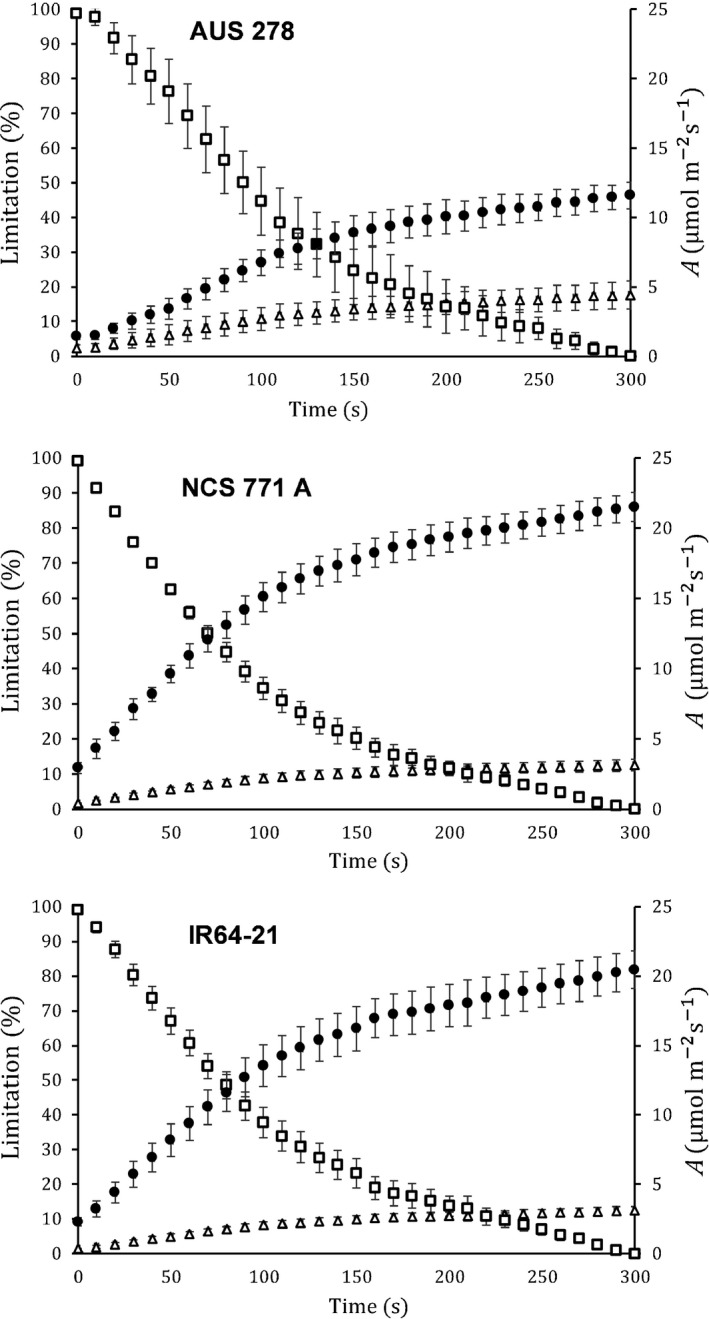
Figure 6.

Nonstomatal (open squares) and stomatal (closed triangles) limitations with leaf CO2 uptake A (closed circles) vs time over the first 300 s of induction for the three selected rice (Oryza sativa) accessions. Nonstomatal and stomatal limitations during induction were calculated relative to the near‐steady‐state value obtained at 300 s. Each point represents the mean (± SE) of four individual plants measured at ambient [CO2].
