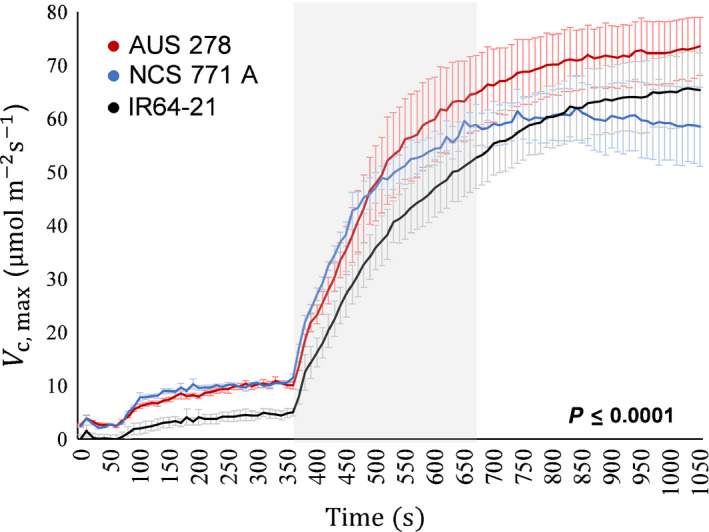
Figure 7.

Apparent maximum rate of carboxylation V c,max with time through induction calculated from the response of leaf CO2 uptake A to intercellular [CO2] C i derived from inductions made at different [CO2], as in Fig. 4. Induction began at 360 s. Significance of difference between the three rice (Oryza sativa) accessions is based on a repeated measures (time) one‐way ANOVA. Each point represents the mean (± SE) of four individual plants.
