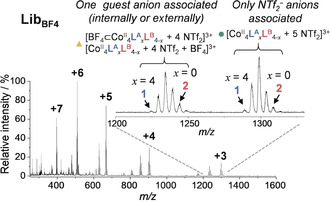
Figure 3.

Low‐resolution ESI‐MS of Lib obtained after addition of TBABF4 (2 equiv) to Lib . The +3 region of the mass spectra is expanded, showing the peak clusters corresponding to cages with no BF4 − (green circle) and cages with one BF4 − associated (yellow triangle).
