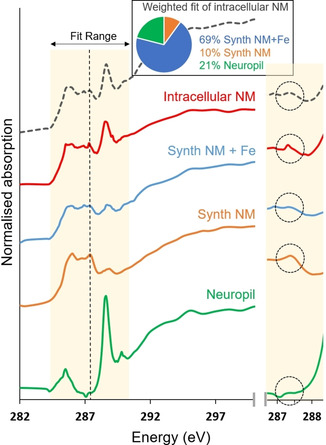
Figure 3.

Carbon K‐edge x‐ray absorption spectra from intracellular NM in PD substantia nigra (case PD1), synthetic NM, synthetic NM+Fe and neuropil region, highlighting an absorption feature that enables specific isolation of NM signal from surrounding tissue without staining. Traces are vertically offset for clarity. A dotted line marks the position of the absorption feature attributed to NM at 287.4 eV, which is not observed within the NM‐free tissue region. Results from linear combination fitting of the intracellular NM spectrum are over‐plotted with a dashed line. Intracellular NM was consistent with 21 % protein and 79 % NM (69 % NM+Fe, 10 % NM), with χ2 value of 0.04 obtained for the fit. The difference between NM and NM+Fe is sufficient to affect fit quality, but we note (as evidenced in the individual traces shown), the differences between NM and NM+Fe arise predominantly from the relative amplitude of features rather than presence or absence of peaks in the energy spectrum. An expanded view of the feature in the energy region 286.5–288.5 eV is shown in the panel on the right.
