
Figure 5.
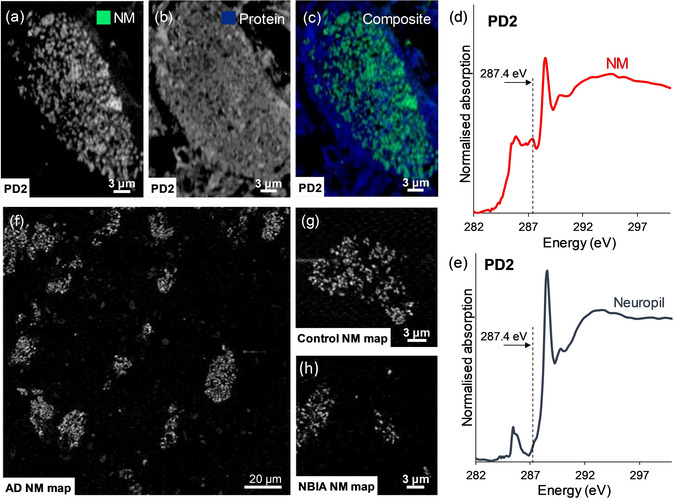
STXM analysis of case PD2, in which for a single neuron, speciation maps show distributions of a) NM, b) protein, c) composite map (NM=green, protein=blue). Carbon K‐edge spectra were also acquired from d) intracellular NM and e) neuropil regions to verify reproducibility of the distinct spectral features observed in PD1 (Figure 3). (f)–(h) show application of NM mapping to post‐mortem human substantia nigra tissue as described in Table S1: f) Alzheimer's disease (AD) case, showing NM distribution over large field of view including multiple pigmented neurons; g) neurologically healthy case (Control), showing NM contrast associated with a single neuron; h) neurodegeneration with brain iron accumulation (NBIA) case, showing contrast associated with neuromelanin deposits in the tissue.