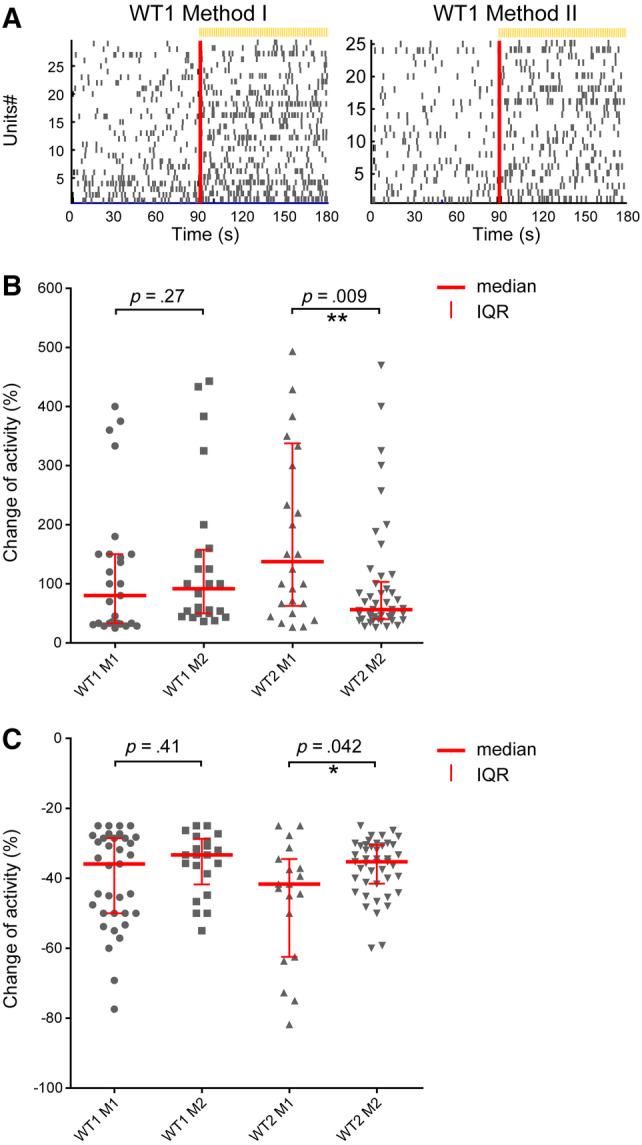
Figure 4.

Light‐driven spiking activity recorded from presumed ON‐Centre retinal ganglion cells (RGCs) and OFF‐Centre RGCs. A, In the raster plot, each small vertical bar indicates the time stamp of a spike, where each row represents a different RGC. The left half illustrates the activity before stimulus onset and, separated by the red line, the right half the activity when exposed to light. B, The change of firing (COF) percentage values from presumed ON‐Centre RGCs are scatter plotted for Method I and Method II of WT1‐2 lines. The median is indicated as a red horizontal line and the interquartile range as a vertical line. Each symbol represents one RGC that showed more than 25% increased spiking after light onset. C, The COF percentage values from presumed OFF‐Centre RGCs are scatter plotted in the same way as described above. We defined outliers as values which exceed three times the standard deviation (three‐sigma rule). A total of five to six organoids were recorded from for each condition. Number of RGCs found to show increased firing in (B) WT1 (M1 = 27 out of 389 RGCs [∼6.9%]; M2 = 24/282 [8.5%]), WT2 (M1 = 26/317 [8.2%]; M2 = 46/496 [9.3%]). Number of RGCs found to show decreased firing in (C) WT1 (M1 = 35 of 389 RGCs [∼9%]; M2 = 21/282 [7.4%]), WT2 (M1 = 19/317 [6%]; M2 = 44/496 [8.8%])
