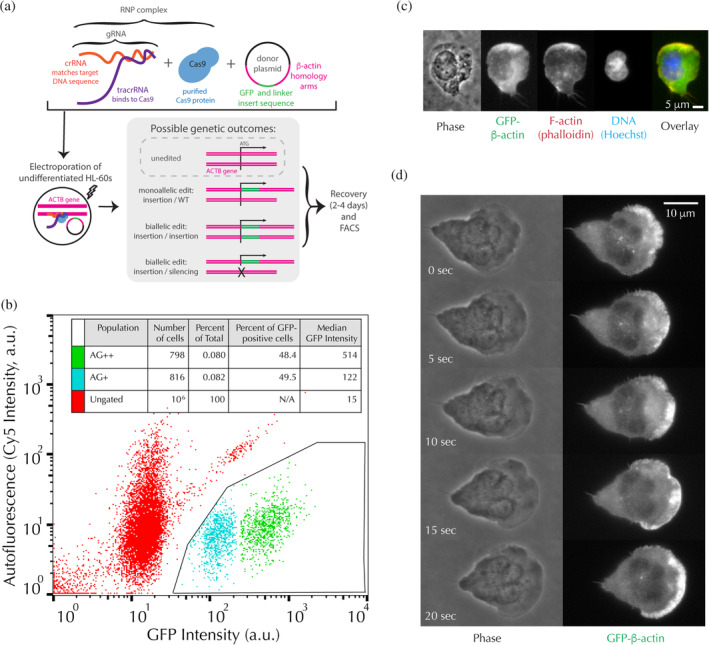
Figure 1.

Biallelic and monoallelic edited cells are viable and exhibit the expected localization of actin. (a) Schematic of the RNP‐transfection protocol used to endogenously tag β‐actin (adapted from Roberts et al., 2017). (b) FACS results from the transfection showing two GFP‐positive populations of cells, henceforth referred to as AG+ and AG++. Fluorescence intensity through a Cy5 filter, used as a measure of autofluorescence, is plotted as a function of GFP fluorescence intensity. Inset: Quantification of relative populations by FACS. (c) Example fluorescence image of a fixed, differentiated AG++ HL‐60 cell. Scale bar: 5 μm. (d) Example time‐lapse montage of Video S1, showing an AG++ cell migrating under agarose imaged simultaneously with far‐red transmitted light for phase contrast and epi‐illumination for GFP excitation. Scale bar: 10 μm
