Figure 3.

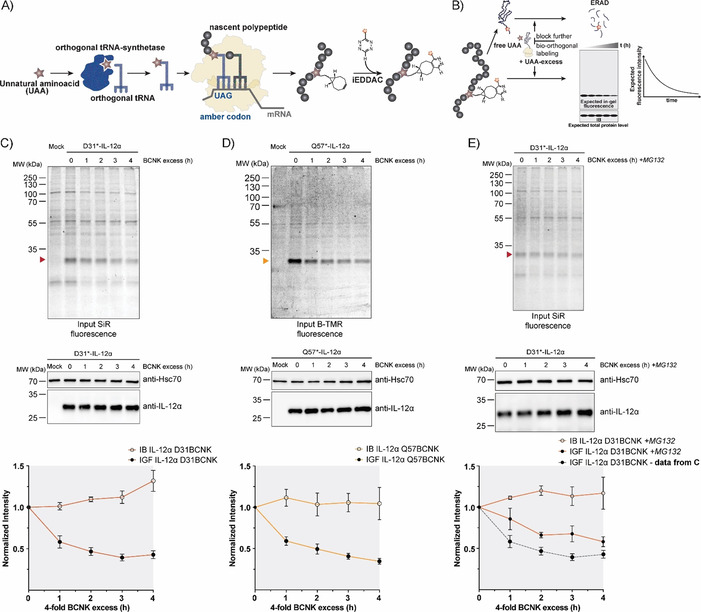
Protein turnover monitored by the uChase approach. A) Workflow of in cellulo bio‐orthogonal labeling. During translation, an in‐frame TAG stop codon is suppressed by an evolved orthogonal tRNA‐synthetase/tRNA pair carrying the UAA. Next, the UAA can be labeled chemoselectively with a suitable probe, such as a fluorophore. B) uChase as a tool for monitoring protein degradation. To monitor protein removal rates (e.g., through ERAD), free UAA is washed out before the labeling reaction. Then, cells are treated with an excess of free UAA for a desired time interval to block any further bio‐orthogonal labeling of newly synthesized proteins without altering the protein biogenesis machinery. The protein half‐life can be measured from intensity plots quantified from in‐gel fluorescence (IGF) intensities of cell lysates. Total protein levels, as measured by immunoblotting (IB), are expected to remain constant. C) Top: Time course of fluorescence decrease for labeled IL‐12α D31BCNK; 0.25 mm BCNK and 400 nm SiR‐tetrazine fluorophore (15 min labeling) were used, followed by incubation with a fourfold excess of BCNK for the indicated time points and analyzed by in‐gel fluorescence. Middle: Total protein levels of IL‐12α D31BCNK were analyzed by immunoblotting. Bottom: The graph shows quantifications from in‐gel fluorescence and immunoblotting data, N=5 (mean± SEM). The intensity of the 0 h time point was set to 1. IB: immunoblotting. IGF: in‐gel fluorescence. D) The same analyses as shown in (C), but for the IL‐12α Q57BCNK variant labeled with B‐TMR [N=4 (mean±SEM)]. E) IL‐12α D31BCNK degradation was inhibited by the proteasomal inhibitor MG132 and the effect was analyzed by use of the uChase assay as in (C), N=4 (mean±SEM). A dotted gray line (bottom panel) shows IGF data from (C), (bottom panel) as a reference.
