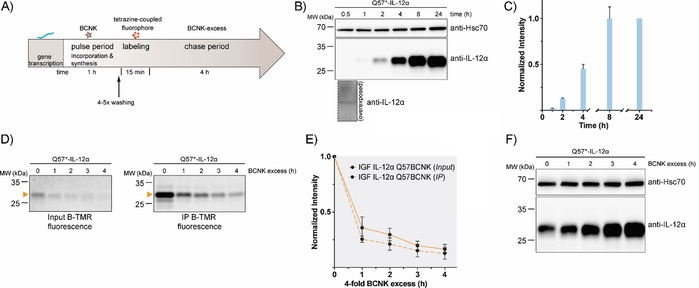
Figure 4.

Establishment of a uChase‐based pulse‐chase assay. A) Illustration of a uPulse‐chase experiment. BCNK addition for a defined time interval (pulse period) allows protein synthesis from mRNA present to occur. After washing out of free BCNK and brief labeling with a tetrazine‐coupled fluorophore, a chase period follows (as described Figure 3 B). B) Representative immunoblots showing expression levels of IL‐12α Q57BCNK after different time intervals of the 0.25 mm BCNK pulse. An overexposure for the 30 min time point is shown below the blot. C) The graph shows a quantification from immunoblots; N=4 (mean±SEM). Samples were normalized for Hsc70 levels. The intensity of the 24 h time point was set to 1. d)–F) Following the schematic in (A), IL‐12α Q57BCNK degradation was followed by a uPulse‐chase experiment. D) Either whole‐cell lysates (Input, left) or immunoprecipitations to increase signal/noise (IP, right) are shown. E) Quantifications of (D); N=4 (mean±SEM). F) Immunoblots of IL‐12α Q57BCNK expression after different time points of the BCNK‐excess‐induced chase. The same samples as in (D), Input, were used, showing a decrease in the fluorescently labeled IL‐12α Q57BCNK pool and an increase in non‐labeled protein levels.
