
Figure 4.
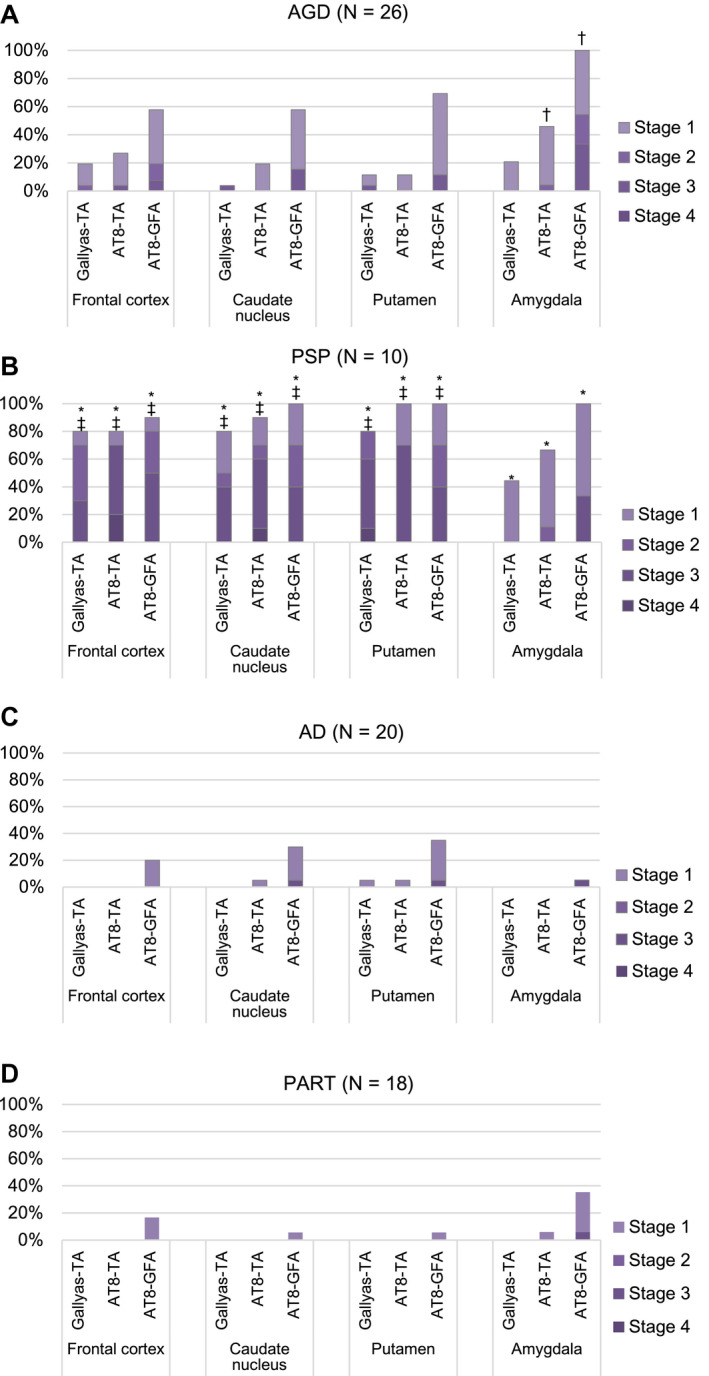
Distribution and density of AT8‐positive GFAs, AT8‐positive TAs and Gallyas‐positive TAs in AGD, PSP, AD and PART groups. A. In AGD cases (N = 26), GFAs and TAs show similar distributions: both lesions most frequently develop in the amygdala, and GFAs are more frequent that TAs in all regions examined. B. In PSP cases (N = 10), GFAs were almost consistently noted in all regions examined, and the proportions of cases having the high density GFAs (stage 2 or over) in the striatum and frontal cortex were higher than that in the amygdala. The distribution pattern of TAs was similar to that of GFAs. C. In AD cases (N = 20), GFAs were more frequent in the striatum compared with the frontal cortex and amygdala, although less frequent than in AGD and PSP cases. D. In PART cases (N = 18), GFAs were the most frequent in the amygdala, whose distribution pattern was similar to that in an AGD rather than AD and PSP groups. *Significant differences between PSP and AD groups (P < 0.01). †Significant differences between AGD and AD groups (P < 0.01). ‡Significant differences between AGD and PSP groups (P < 0.01). Kruskal–Wallis and Steel–Dwass tests.