
Figure 5.
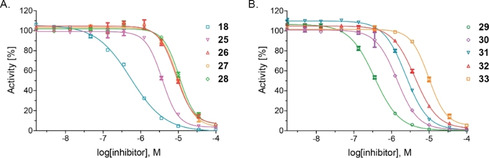
Representative dose‐response curves used to determine IC50 values for C‐3 aminoalkyl‐substituted 2,4‐PDCA derivatives 18 and 25–33. Two dose‐response curves each composed of technical duplicates were independently determined by using SPE‐MS AspH inhibition assays and manifest high Z’‐factors36 and signal‐to‐noise ratios (Figure S2). Assays were performed as described in the Experimental Section by using 50 nM His6‐AspH315‐758, 1 μM hFX‐CP101‐119 (Figure 2D), 100 μM l‐ascorbic acid (LAA), 3 μM 2OG, and 2 μM FeII in 50 mM HEPES buffer (pH 7.5, 20 °C). Data are shown as the mean average of two technical duplicates (n=2; mean ± SD).