Figure 1:

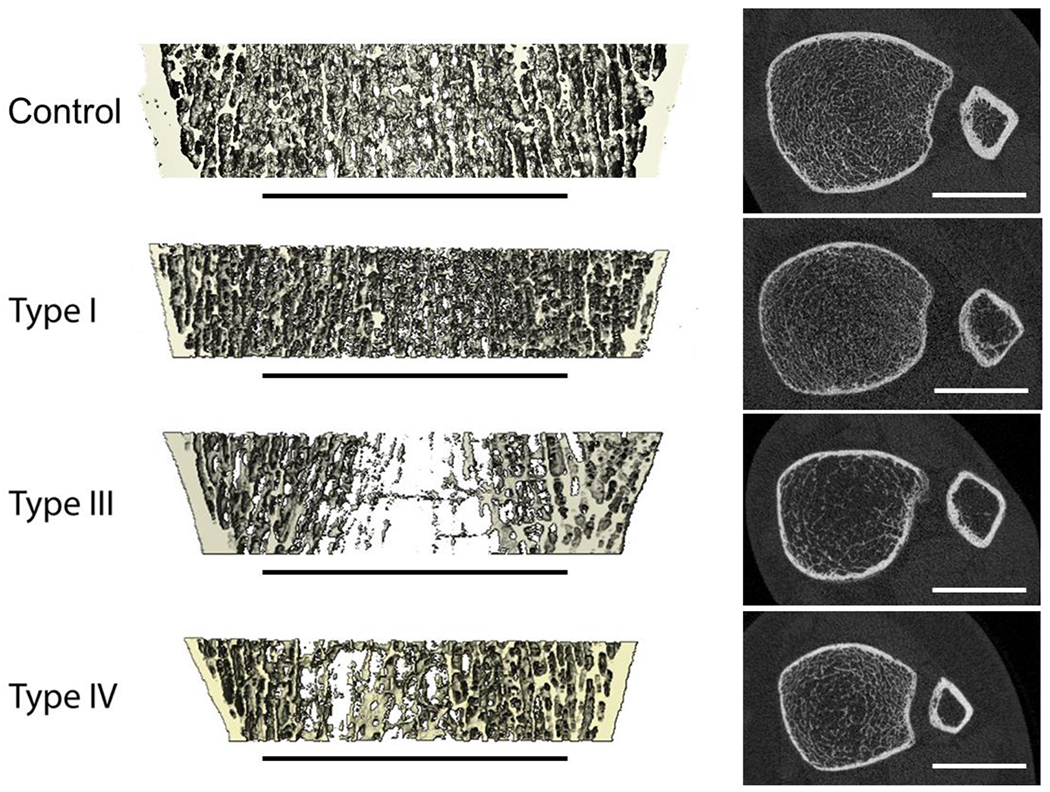
HR-pQCT images of the distal tibiae of healthy and OI subjects with different clinical severity of the disease. Left: 3D renderings of sagittal sections; right: axial HR-pQCT slices. Scale bars indicate 20 mm.

HR-pQCT images of the distal tibiae of healthy and OI subjects with different clinical severity of the disease. Left: 3D renderings of sagittal sections; right: axial HR-pQCT slices. Scale bars indicate 20 mm.