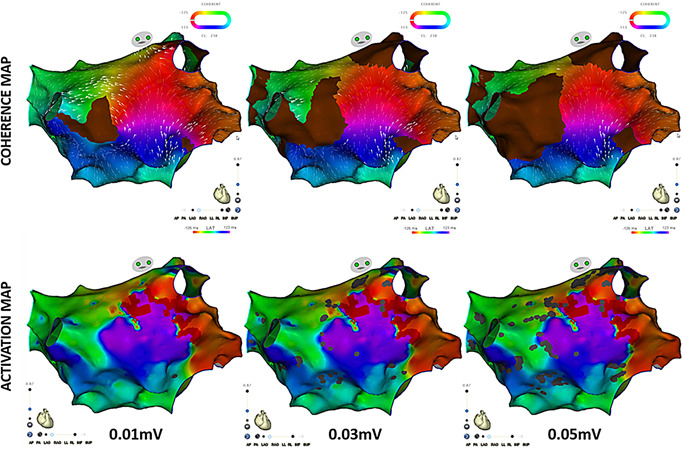
Figure 1.

Effect of different scar settings on activation and coherent maps for identification of isthmus site top panels correspond to coherent maps. The bottom panels correspond to LAT maps. The scar threshold setting was adjusted with 0.01, 0.03, and 0.05 mV thresholds from left to right, respectively. The figure demonstrates increasing SNO areas on the recalculated coherent maps and increasing patches of gray areas on the LAT maps as the scar threshold setting is increased. The changes are more apparent on the coherent maps than the LAT maps. The 0.01 mV is shown only for demonstration purpose but was not applied during the actual cases because a threshold less than 0.03 mV is below the noise threshold for the CARTO system. LAT, local activation time; SNO, slow or nonconduction areas
