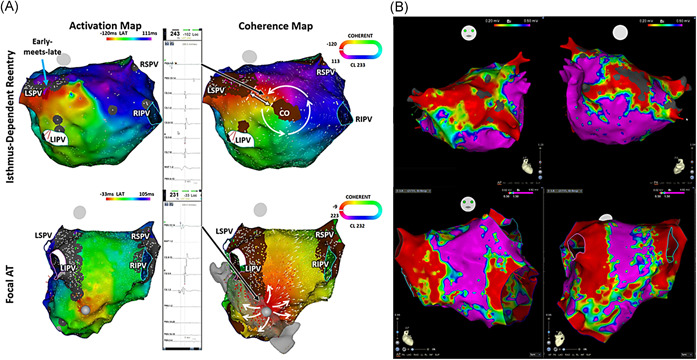
Figure 2.

A, Sample cases 1 and 2. Examples of critical sites: isthmus‐dependent re‐entry (IDR; upper panel) and focal AT (lower panel) on activation (left panel) and coherent map (right panel). IDR on coherent map (upper right panel) at the left atrial posterior wall with the circuit rotating around a nonconducting central obstacle (CO) represented by a brown SNO site with identifiable slow conduction (fractionated electrogram, upper middle panel) at narrow isthmus site (white double‐ended arrow), bordered by the nonconducting CO and another SNO site, that was not seen on standard activation mapping (upper left panel). Focal activation with the radial spread at breakout site (earliest activation site) identified by both activation and coherent maps. B, Corresponding voltage map of sample case 1 (isthmus‐dependent AT, top panel) and case 2 (focal AT, bottom panel) (Figure 2A above) acquired during sinus rhythm. AT, atrial tachycardia; LIPV, left inferior pulmonary vein; LSPV, left superior pulmonary vein; RIPV, right inferior pulmonary vein; RSPV, right superior pulmonary vein; SNO, slow or nonconducting
