
Figure 3.
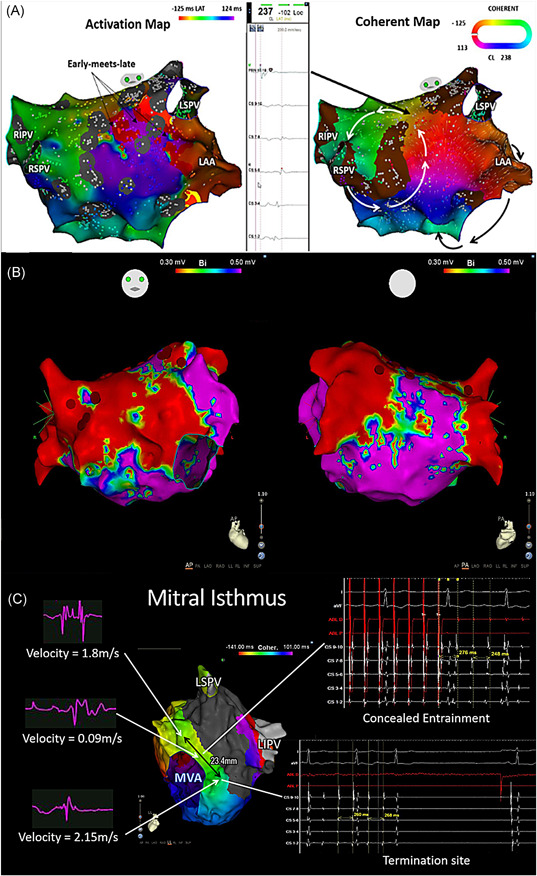
Sample case 3 comparisons of the standard activation map and coherent map. A, Top left panel: activation map showing early‐meets‐late at the left atrial (LA) roof and base of the LAA. Top middle panel: Fractionated electrogram at the critical isthmus identified by coherent map at the LA roof. Top right panel: coherent map showing multiple loops of the AT with the narrowest width located at the LA roof and a common isthmus at the LA anterior wall shared by a roof macroreentrant circuit and another circuit rotating around the mitral annulus. B, Corresponding voltage map of sample case 3 (Figure 3A above) acquired during sinus rhythm. C, Bottom panel: critical isthmus site bordered by anatomical and functional nonconducting areas showed slow conduction, concealed entrainment and was verified by termination with ablation. AT, atrial tachycardia; LA: left atrium; LAA, left atrial appendage; LAT, local activation time; LIPV, left inferior pulmonary vein; LSPV, left superior pulmonary vein; RA, right atrium; RIPV, right inferior pulmonary vein; RSPV, right superior pulmonary vein