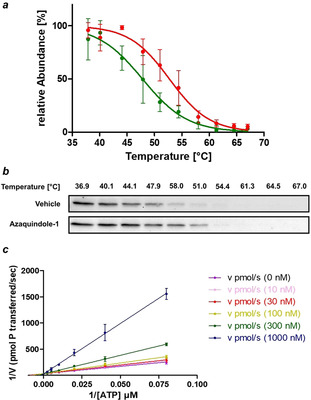
Figure 4.

a) Cellular thermal shift assay (CETSA) for the binding of azaquindole‐1 (10 w‐j) to VPS34 in cell lysate (green line=VEH; red line=10 w‐j). Data is mean ± SD, n=3; b) Representative CETSA blot. See Section 5.8 in the Supporting Information for further details. c) Lineweaver–Burk plot for inhibition of VPS34 by 10 w‐j. Data is mean ± SD, n=3.
