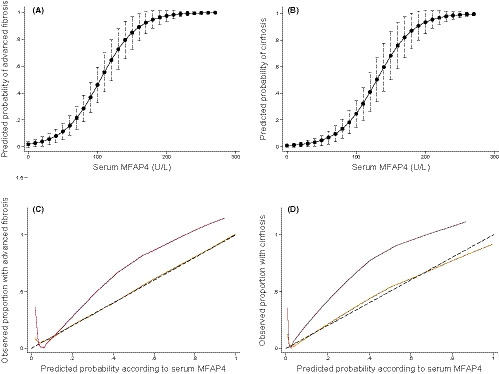
FIGURE 4.

Risk prediction and calibration curves according to serum MFAP4. (A and B) Risk prediction curves to evaluate the probability of advanced fibrosis and cirrhosis constructed by logistic regression with serum concentration of MFAP4 in the test cohort. (C and D) Calibration slopes for MFAP4 in the test (yellow) and validation cohort (red). The slopes graph the agreement between predicted probability of advanced fibrosis/cirrhosis on the x‐axis and observed proportion with advanced fibrosis/cirrhosis on the y‐axis. The black dashed line represents perfect calibration, with 100% agreement
