FIGURE 2.

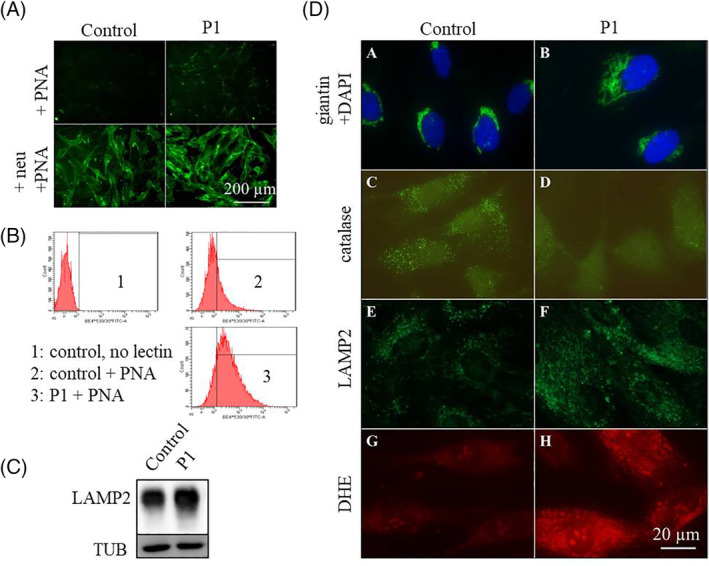
Altered cellular structure and ultrastructure found in P1's fibroblasts. Immunocytochemical (ICC) labelling of the fibroblasts with fluorescently tagged PNA lectin, A, showed an increased signal in P1 compared to the control (the upper part), suggesting a decreased sialylation of mucin type O‐glycoproteins; neuraminidase treatment prior to the staining (the bottom part) was used as a positive control. Quantification of the PNA binding was performed after the analysis of the labelled cells with flow cytometry, confirming the results discerned by ICC; histogram plots, B, show the fluorescent signal distribution in a healthy control vs P1 (x‐axis: fluorescence intensity; y‐axis: cell count). A complex defect in cellular glycosylation was corroborated by Western blot of LAMP2 (C), which revealed a smear with some additional bands in P1's sample corresponding to the underglycosylated forms of the protein. The structure of Golgi apparatus, DA,B, was visualised by ICC using anti‐giantin antibody, showing an altered morphology in the patient characterised by a higher ratio of cells with dilated Golgi (for multiple visual fields, see Figure S6); peroxisomal signal of catalase, DC,D, was decreased in P1; increased abundance of the lysosomal marker LAMP2, DE,F, was detected in P1, as well as elevated DHE signal reflecting a higher level of reactive oxygen species, DG,H. Quantification of ROS levels was performed using flow cytometry analysis after DHE staining, see Figure S7
