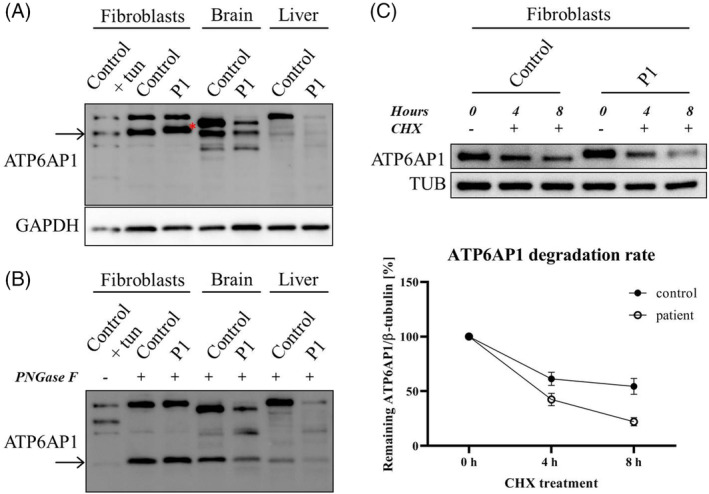
FIGURE 3.

Protein analysis of ATP6AP1 in P1's tissues and his cultured fibroblasts. Western blot was performed in the whole cell lysates from fibroblasts and tissue homogenates. A, While ATP6AP1 (a band of ~ 62 kDa) was decreased in P1's frontal cortex and liver (to 29% and 42% of the control values, respectively), the signal in his fibroblasts was stronger than the control's (~1.7‐fold) and had a slower mobility (red asterisk). After PNGase F treatment, B, the band in all samples shifted to ~48 kDa, which corresponds to the mass of deglycosylated ATP6AP1, a small fraction of which is also present in cells cultured for 1 day with tunicamycin (tun; 5 μg/ml). Cycloheximide (CHX) chase assay, C, uncovered a reduced stability of the protein in the patient's fibroblasts (the degradation rate was compared with the relative amount of ATP6AP1 at the time point 0 hours set to 100%; mean values ± SEM are shown)
