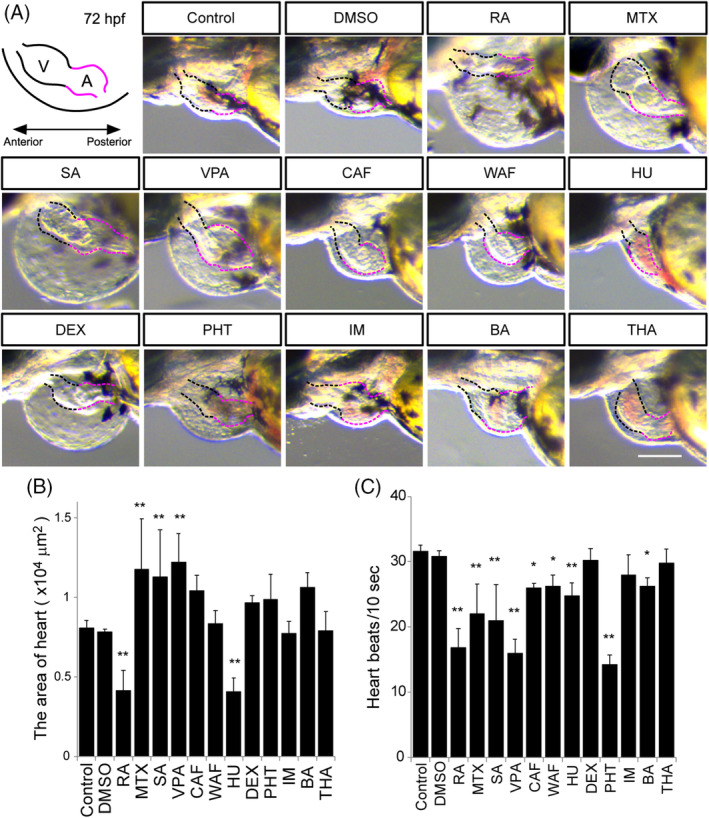
FIGURE 8.

Morphological defects of the heart and measurement of the heart beat rate. A, Illustration of the embryonic heart at 72 hpf. V stands for the ventricle marked by the black‐dotted line. A stands for the atrium marked by the red‐dotted line. B, The maximum ventricle ventricular and maximum atrium diastole were measured. C, Heart beat rate was calculated in a 10‐second window based on supplemental [Link], [Link]. Asterisks indicate statistically significant differences between groups (*P < .05, **P < .01, n = 5). Scale bar: 100 μm
