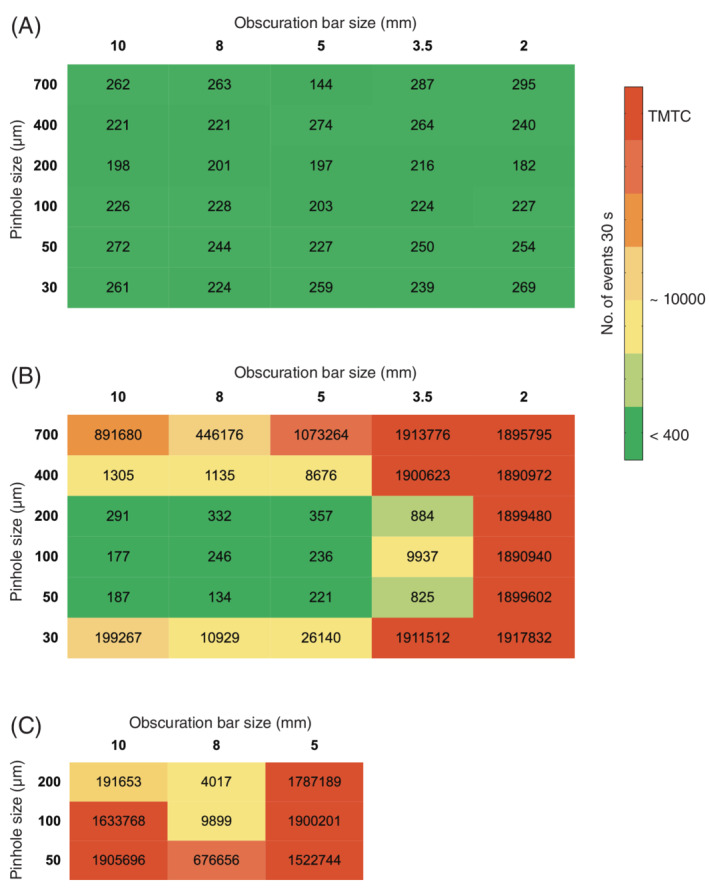
Figure 2.

Matrix showing the number of events from a 30 s background measurement. The numbers in each cell represents the number of events under conditions as defined by the size of the obscuration bar (horizontal) and the size of the pinhole (vertical). Panel A shows the results when fluorescence threshold is applied (threshold 0.62). Panel B shows the results for the same configurations as in Panel A but in FSC threshold mode (threshold 0.72). To further enhance configurations with the lowest numbers of events in the FSC threshold mode (50‐, 100‐, 200‐nm pinholes in combination with either a 5‐, 8‐, or 10‐mm obscuration bar), these combinations were recorded again, with a reduced threshold (0.27) as displayed in Panel C. [Color figure can be viewed at wileyonlinelibrary.com]
