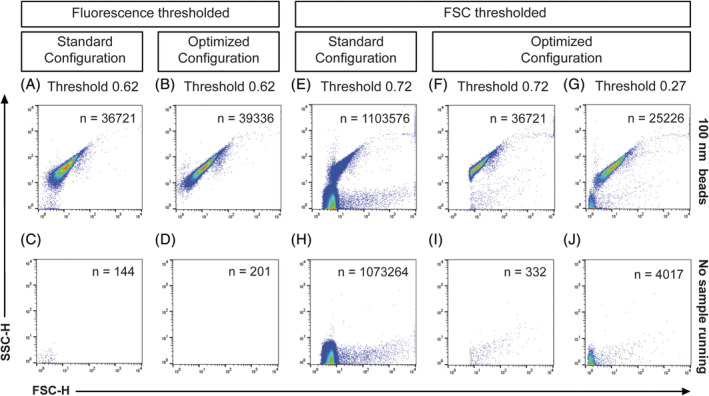
Figure 3.

Measurements of 100 nm polystyrene beads in fluorescence (A, B) or FSC (E–G) threshold mode with the respective measurements without sample running (C, D) and (H–J) as background definition. Density plots show a comparison between the standard configuration (5‐mm obscuration bar, 700‐μm pinhole) and the optimized configuration (8‐mm obscuration bar, 200‐μm pinhole). [Color figure can be viewed at wileyonlinelibrary.com]
