Figure 4.

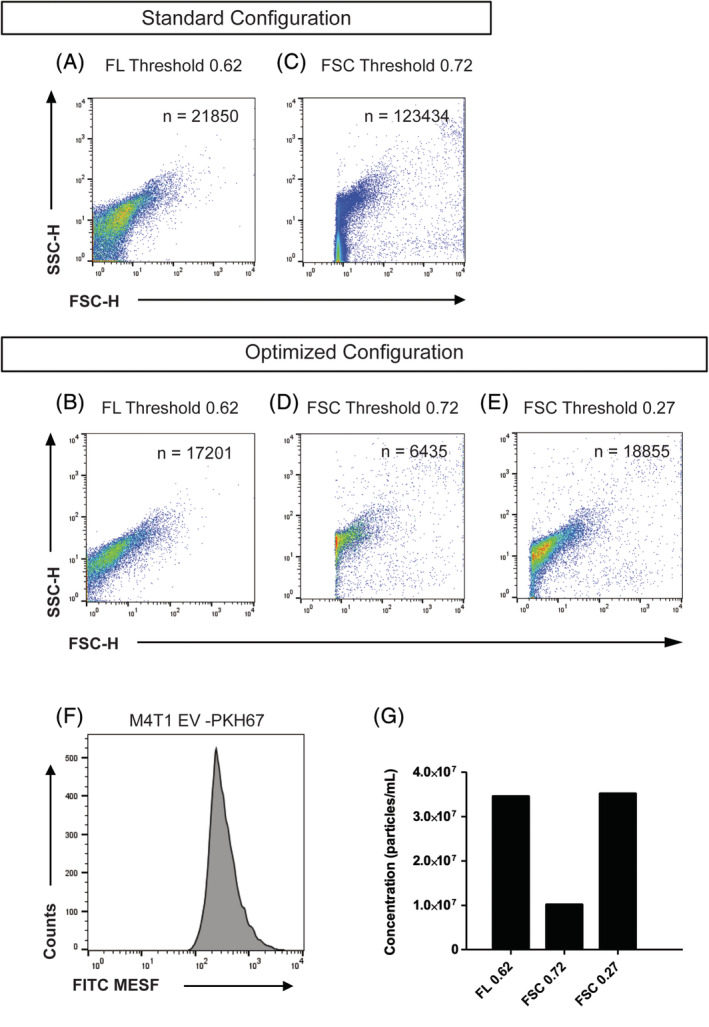
Density plots showing measurements of PKH67‐stained M4T1 derived EV in a comparison between the standard configuration of the FSC detector optics (5‐mm obscuration bar, 700‐μm pinhole, A, C) and the optimized configuration (8‐mm obscuration bar, 200‐μm pinhole, B, D, E). Panels A and B are in fluorescence thresholding mode. Panels C–E are in FSC thresholding mode. F Histogram displaying FITC‐MESF calibrated axis for PKH67 stained M4T1 EV, same as shown in Panel B. (G) Bar graph displaying concentration measured with the optimized configuration in fluorescence thresholding mode (threshold value of 0.62) and FSC thresholding mode (threshold values of 0.72 and 0.27) as indicated. Concentration was corrected for dilution, flow rate, time measurement and the number of events detected in PBS background controls (which total numbers of events were 185, 1,456, and 1,522 respectively). [Color figure can be viewed at wileyonlinelibrary.com]
