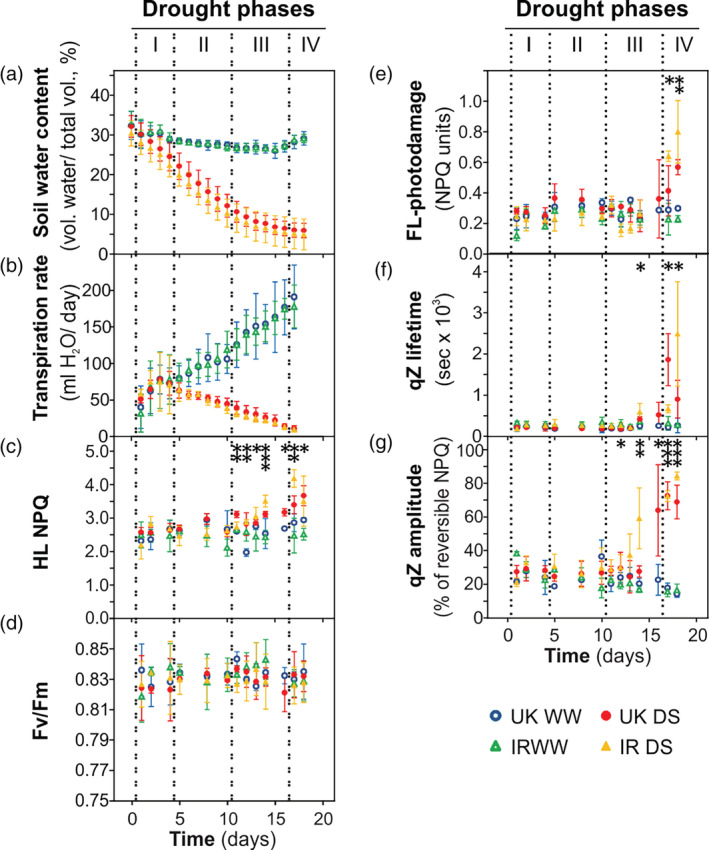
FIGURE 2.

Drought phases in the United Kingdom (UK) and Iran (IR) wheat cultivars in well‐watered condition (WW) and in drought stress (DS) in chamber conditions. “Time (days)” refers to the duration of drought treatment (day 0 denotes the last day of watering for treated plants). (a) Soil water content. (b) Transpiration rate. (c) Non‐photochemical quenching (NPQ) values at the end of the high light phase (HL) of fluctuating light (FL) analysis (HL NPQ). (d) Fv/Fm. (e) Fluctuating light (FL)‐induced photodamage. (f) Lifetime of qZ component of the reversible NPQ in FL analysis. (g) Amplitude of qZ component in FL analysis. Asterisks indicate the p‐values of the control versus drought comparison by two‐way Analysis of variance analysis (.01 < p < .05 is marked by *, .001 < p ≤ .01 by **, p < .001 by ***). Data are means ± SD (n = 5). NPQ, non‐photochemical quenching [Colour figure can be viewed at wileyonlinelibrary.com]
