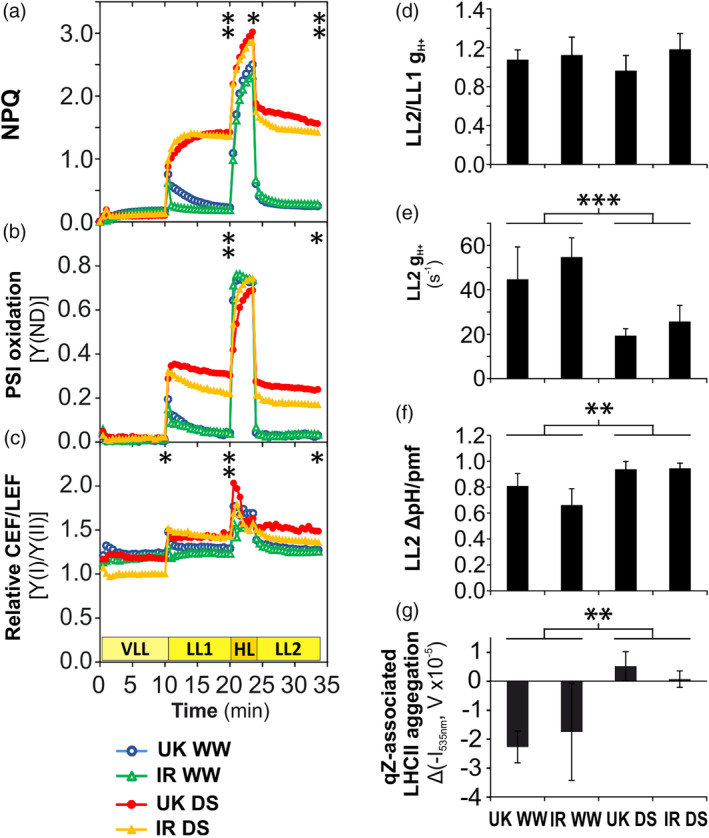
FIGURE 3.

Short‐term modifications (time scale of minutes) of light reactions in the UK and IR wheat cultivars in the chamber experiment during Drought Phase III. (a‐c) Fluctuating light (FL) analysis. (a) Non‐photochemical quenching (NPQ). (b) Photosystem I (PSI) oxidation. (c) Relative changes of cyclic and linear electron flow ratio (CEF/LEF). (d) Ratio of proton conductivity through chloroplast ATP synthase (gH+) between LL1 and LL2 light phases. (e) gH+ at LL2. (f) Trans‐thylakoid ΔpH at LL2 (as fraction of proton motive force, pmf). (g) Relative variations of the aggregation of LHCII trimers associated to qZ. Asterisks indicate the p‐values of the control versus drought comparison by two‐way Analysis of variance analysis (.01 < p < .05 is marked by *, .001 < p ≤ .01 by **, p < .001 by ***) at the end of every light phase. Data are means ± SD (n = 3) (error bars are not indicated from panel a to c for clarity). WW, well‐watered; DS, drought‐stressed [Colour figure can be viewed at wileyonlinelibrary.com]
