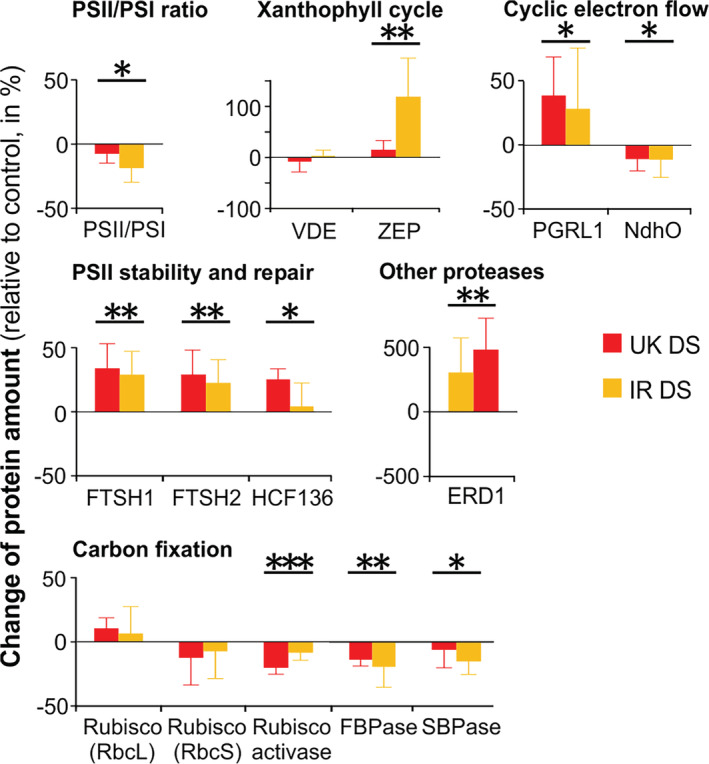
FIGURE 5.

Variation of protein content under drought stress (DS), relative to the respective control (well‐watered) plants (in percentage) in UK and IR wheat cultivars in the chamber experiment at Drought Phase IV. Data are means ± SD (n = 5). Asterisks indicate the p‐values of the control versus drought comparison by two‐way Analysis of variance analysis (.01 < p < .05 is marked by *, .001 < p ≤ .01 by **, p < .001 by ***). More information on single proteins is available in Table S3 [Colour figure can be viewed at wileyonlinelibrary.com]
