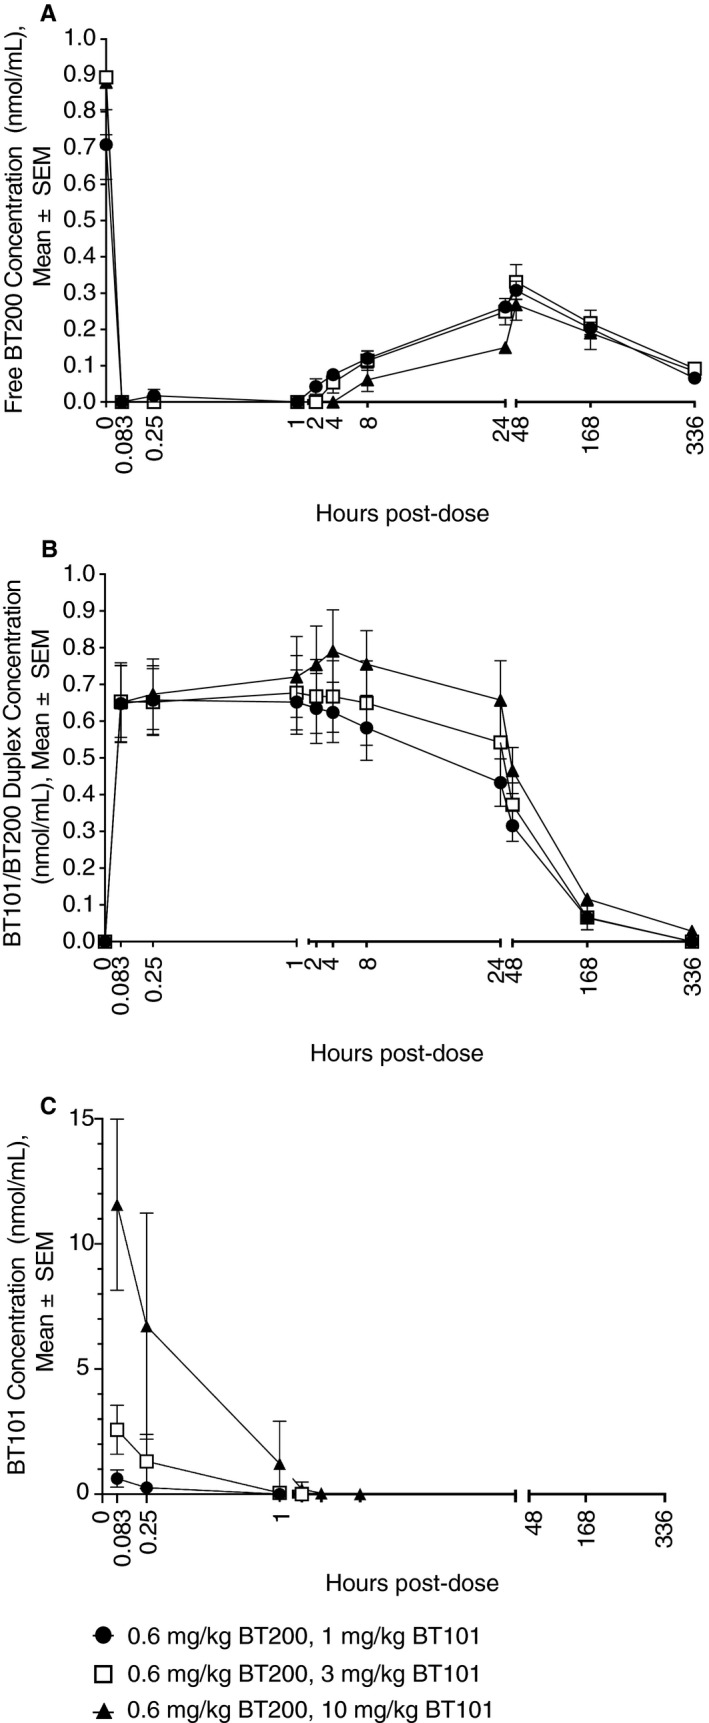
Figure 7.

Plasma concentrations of BT200 (A), BT101/BT200 duplex (B), and BT101 (C) after subcutaneous administration of BT200 (0.6 mg/kg) followed 24 hours later by intravenous administration of BT101 at 1 mg/kg (●), 3 mg/kg (□), or 10 mg/kg (▲). For BT101, only time points with concentrations exceeding the limit of quantitation (0.125 nmol/mL) are presented on the graph. Each concentration represents the mean of three animals ± standard error (SEM).
