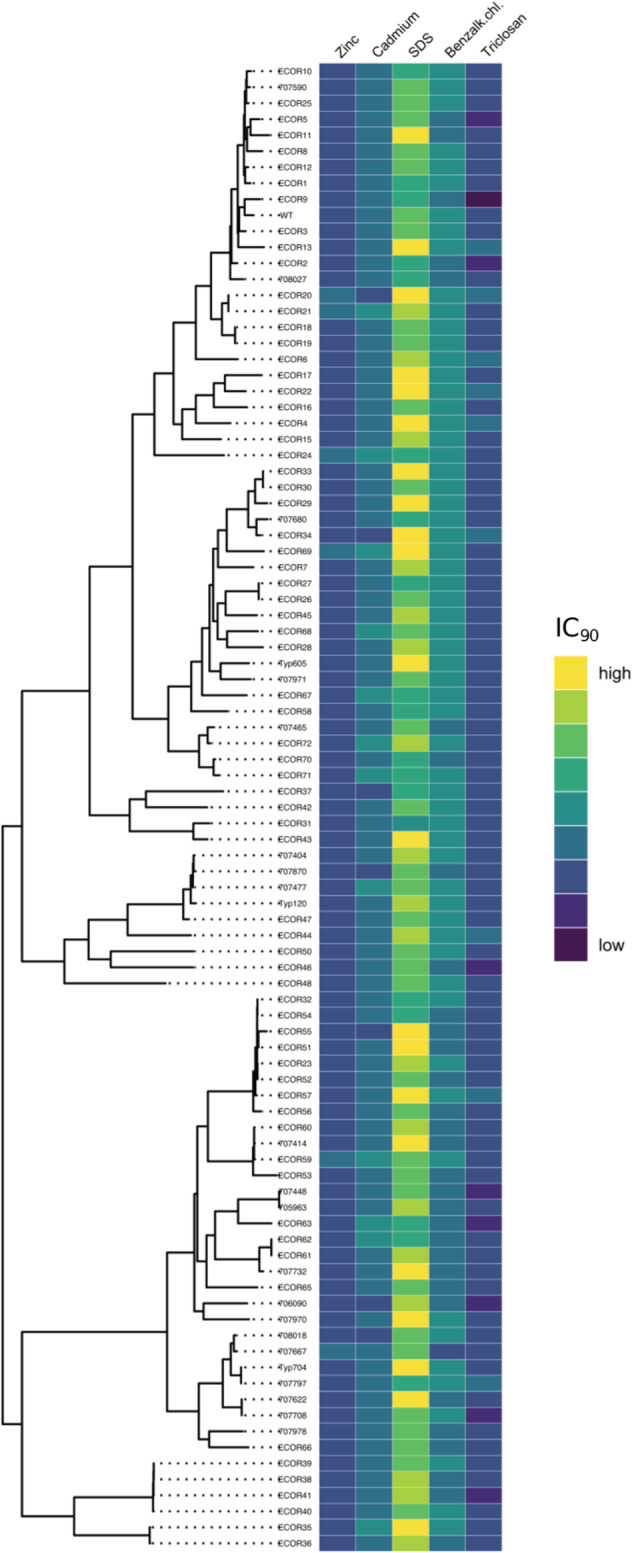
Figure 2.

Susceptibility profiles of natural and clinical isolates toward the five tested NAAs, grouped according to core‐genome phylogeny.
In the heat map, blue shades indicate an isolate with a relatively low IC90 to the range of tested concentrations, yellow shades indicate a relatively high IC90.
The core‐genome phylogenetic tree for natural and clinical isolates at left was adapted from (Allen et al., 2017). Benzalk.chl. is benzalkonium chloride.
Range of tested concentrations for each compound (twofold broth dilution): zinc 8192–16 μg/ml; cadmium 20–0.0390625 mmol/l; SDS 4–0.0078125 mg/ml; benzalkonium chloride 256–0.5 μg/ml; triclosan 4–0.0078125 μg/ml.
