
Figure 3.
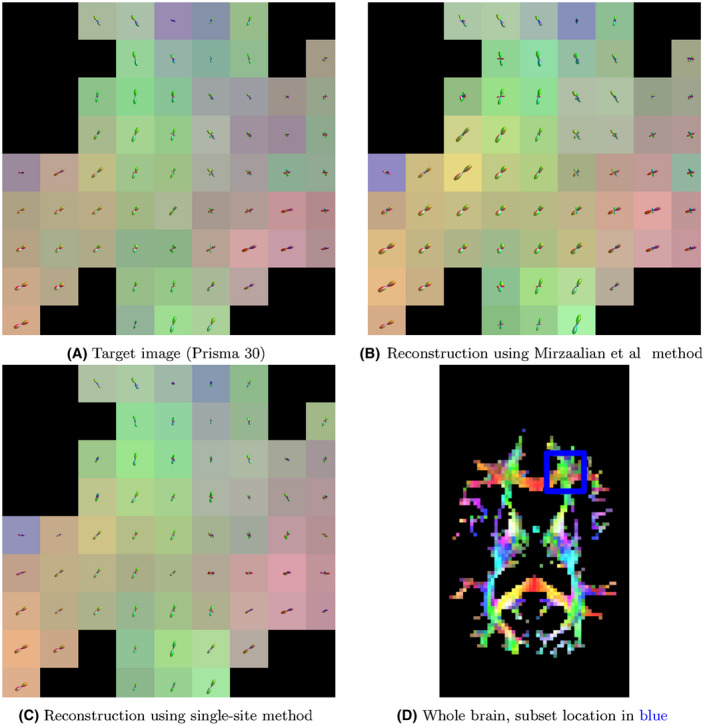
Here, we plot exemplar FOD glyphs (estimated via MSMT‐CSD) from the actual data, a reconstruction using the Mirzaalian et al method, and a reconstruction using the proposed single‐site method. Inputs to each reconstruction were the data from the Prisma 60 protocol/site. The background colors represent the direction of the FOD maxima