
Figure 3.
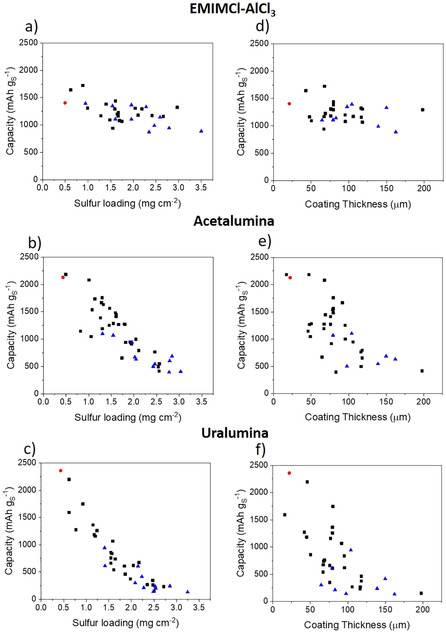
1st discharge capacity values plotted against the sulfur loading (a–c) or the cathode coating thickness (d–f) in EMIMCl–AlCl3 (a, d), acetalumina (b, e) and uralumina (c, f). The black square symbols show the results obtained with the electrodes coated on a thicker (25 μm) Mo foil, whereas the red circles show the results using a thinner (10 μm) Mo foil. In both cases, the electrodes contain 60 % sulfur and CNT as the only carbon source. The blue triangles show the results of electrodes made with a small amount (1–8 %) of other carbon additives mixed with CNT.